Introduction
The log-normal distribution is a fascinating statistical concept commonly used to model data that exhibit right-skewed behavior. This distribution has wide-ranging applications in various fields, such as biology, finance, and engineering. In this article, we will delve into the log-normal distribution, its key parameters, and how to interpret them, as well as explore some practical examples to enhance understanding.
Overview
- A log-normal distribution models data where the natural logarithm of a variable follows a normal distribution, showing positive skewness.
- Understand the shape (σ), scale (m or eμ), and location (μ) parameters to interpret and apply the log-normal distribution.
- The log-normal distribution is connected to the normal distribution; if X is log-normal, ln(X) is usually distributed, and vice versa.
- Estimate parameters μ σ from data using techniques like Maximum Likelihood Estimation, which involves log transformation and calculating the mean and standard deviation.
- The log-normal distribution is widely used in biology, finance, reliability engineering, and environmental science to model right-skewed data such as growth rates, stock prices, and time to failure.
Table of contents
What is a Log-normal Distribution?
A log-normal distribution describes the probability distribution of a random variable when its logarithm follows a normal distribution. In simpler terms, if the natural logarithm of a variable X follows a normal distribution, then X follows a log-normal distribution. This distribution remains continuous and features positive skewness, meaning it has a long right tail.
Key Parameters
There are primarily three parameters as follows:
- Shape Parameter (σ): This parameter affects the general shape of the distribution. It is also the standard deviation of the log-transformed variable.
- Scale Parameter (m or eμ): This parameter stretches or shrinks the distribution’s graph. In this distribution, the scale parameter is often called the median.
- Location Parameter (μ): This parameter determines where on the x-axis the graph is located. It is the mean of the log-transformed variable.
These parameters are critical in understanding how this distribution behaves and how it can be applied to real-world data.
Also Read: What is Normal Distribution : An Ultimate Guide
Probability Density Function
The probability density function (PDF) of a log-normal distribution is given by:
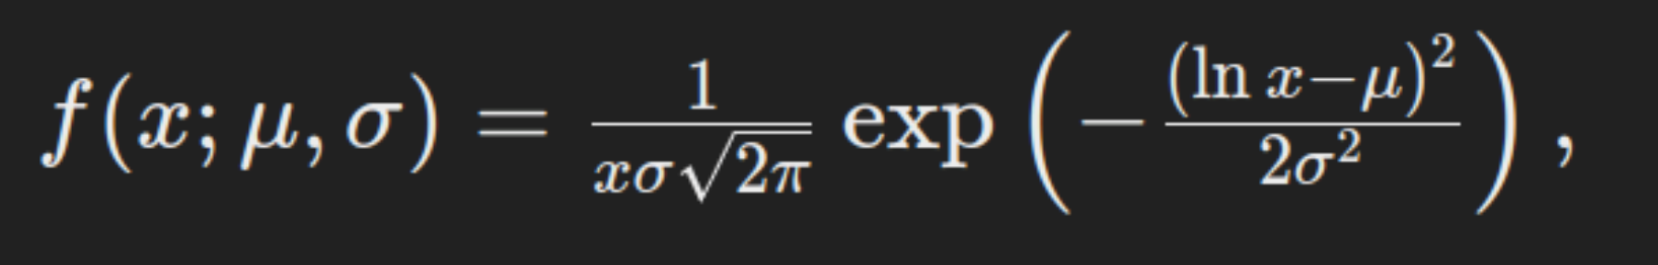
where x>0, μ is the mean of the variable’s logarithm, and σ is the standard deviation of the variable’s logarithm. This formula shows that the log-normal distribution is defined for positive values only, as the logarithm is not defined for non-positive values.
Relationship with the Normal Distribution
One of the most interesting aspects of its relationship with the normal distribution. If X follows a log-normal distribution, Y = ln(X) follows a normal distribution. Conversely, if Y follows a normal distribution, X = eY follows a log-normal distribution. This relationship allows us to use well-established methods for normal distributions to analyze log-normal data by transforming the data using logarithms.
Calculating Parameters from Data
We often use methods such as Maximum Likelihood Estimation (MLE) to estimate the parameters of this form of distribution from data. Here’s a simplified approach to estimate μ and σ:
- Log-transform the data: Take the natural logarithm of all data points.
- Calculate the log-transformed data’s sample mean and standard deviation: These statistics will be the estimates for μ and σ.
For example, consider a dataset of log-normally distributed incomes. By taking the natural logarithm of each income, we can compute the mean and standard deviation of these log-transformed values to estimate μ and σ.
Practical Applications
This distribution is widely used in various fields due to its ability to model skewed data. Here are some examples:
- Biology: In biological studies, organisms’ growth rates often follow a log-normal distribution because growth rates are multiplicative rather than additive.
- Finance: Stock prices are commonly modeled using log-normal distributions because the percentage change in prices is normally distributed.
- Reliability Engineering: The time to failure of certain products can be modeled using a log-normal distribution, especially when the failure process is multiplicative.
- Environmental Science: The distribution of particle sizes in aerosols or the amount of rainfall in a given period.
Example Calculation
Let’s consider a practical example to calculate the parameters of a log-normal distribution. Assume we have the following income data (in thousands): 20, 22, 25, 27, 30.
- Log-transform the data:

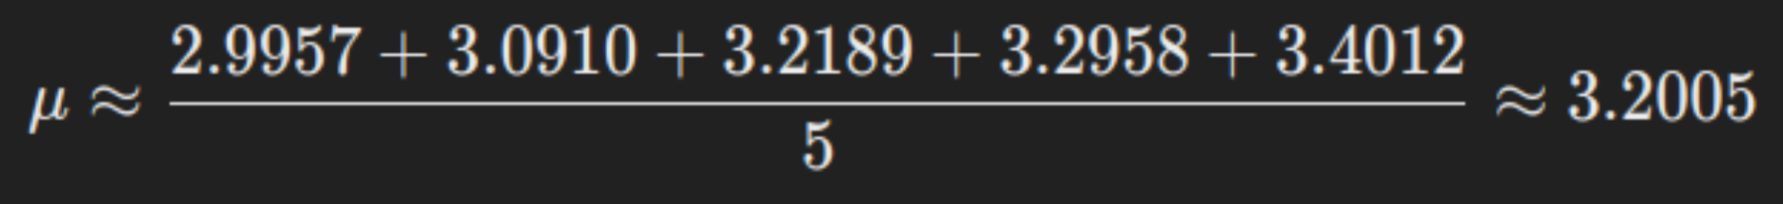
- Calculate the sample mean μ:
- Calculate the sample standard deviation (σ):
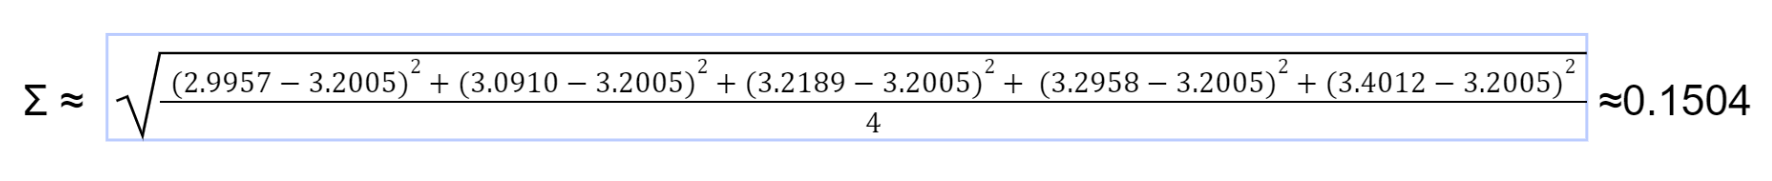
Thus, the estimated parameters for the log-normal distribution are μ approx 3.2005 and σ approx 0.1504.
Interpreting the Parameters
- μ: This is the mean of the log-transformed data. In our example, a μ of 3.2005 indicates that the average of the natural logarithms of the incomes is around this value.
- σ: This is the standard deviation of the log-transformed data. A σ of 0.1504 suggests that the log-transformed incomes are relatively close to the mean on a logarithmic scale.
Conclusion
The log-normal distribution is a powerful tool for modeling right-skewed data. We can effectively analyze and interpret data in various fields by understanding its key parameters and their relationship with the normal distribution. Whether dealing with financial data, biological growth rates, or reliability metrics, it offers a robust framework for understanding and predicting behavior.
Frequently Asked Questions
Q1. How do you interpret a lognormal distribution?
A. A lognormal distribution describes a variable whose logarithm is normally distributed, meaning the original variable is positively skewed and multiplicative factors cause its variation.
Q2. What is the log of a normal distribution curve?
A. The log of a normal distribution curve converts a lognormal distribution into a normal distribution, meaning if 𝑋, is lognormally distributed, ln(𝑋), is normally distributed.
Q3. Why is the log-normal distribution important?
A. The log-normal distribution is important because it models many natural phenomena and financial variables where values are positively skewed, and it helps in understanding and predicting multiplicative processes.
Seasoned AI enthusiast with a deep passion for the ever-evolving world of artificial intelligence. With a sharp eye for detail and a knack for translating complex concepts into accessible language, we are at the forefront of AI updates for you. Having covered AI breakthroughs, new LLM model launches, and expert opinions, we deliver insightful and engaging content that keeps readers informed and intrigued. With a finger on the pulse of AI research and innovation, we bring a fresh perspective to the dynamic field, allowing readers to stay up-to-date on the latest developments.


