Introduction
Imagine being a medical student needing to visualize complex anatomical structures or a data scientist creating interactive 3D models. PyVista offers the precision and interactivity required to make these tasks engaging and insightful. We’ll start by exploring PyVista’s features and installation, then create stunning human anatomy visualizations, such as the brain, chest, and whole human body. Finally, we’ll master advanced techniques to customize these visualizations. By the end of this blog, you’ll be ready to create detailed 3D visualizations with ease.
Learning Objectives
- Understand the main features and modules of the PyVista library.
- Learn all the ways to install this library in your system.
- Learn how to visualize the various human anatomy visualizations PyVista provides.
- Understand all the customizations PyVista offers, such as volume rendering, shading, opacity adjustments, and more.
This article was published as a part of the Data Science Blogathon.
Table of contents
Introduction to PyVista
PyVista is one of the most powerful 3D visualization libraries available out there. It is built on top of the Visualization Toolkit (VTK) and offers many customizations through various parameters to create detailed visualizations. Using the PyVista interface, we can interact with our visualizations and examine them in detail. One of the main features of this library is that it has a ton of inbuilt 3D datasets, making it easy to use. This library offers a wide range of features such as lighting adjustment, filtering, adding widgets to visualizations, creating mesh objects, and allowing custom adjustments in some features. It has many filter options so that we can visualize our object or plot in various ways and understand it thoroughly.
Key Features of PyVista
Let us now explore features of PyVista in detail.
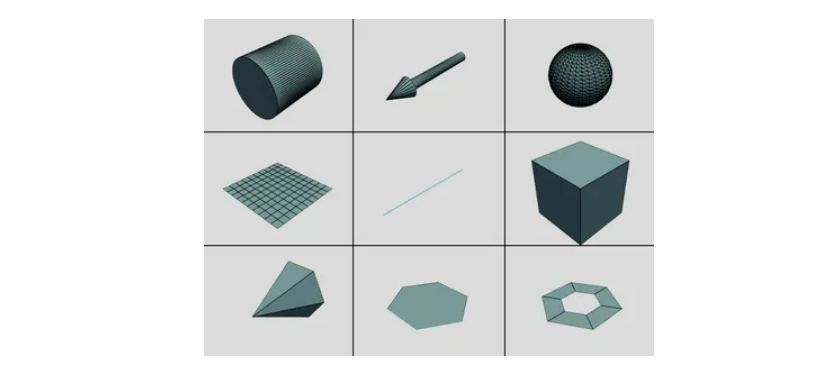
Mesh Creation
Creating and editing 3D meshes is one of the main features of PyVista. This library allows us to read many file types into mesh objects, such as creating meshes from NumPy arrays and creating common objects like cubes, arrows, spheres, etc. Once we create a mesh object, we can plot and integrate it into another visualization with just a few lines of code.
Filtering
PyVista provides a Filter module, which allows us to perform a wide range of tasks, such as analyzing and manipulating mesh data, slicing and cutting meshes, computing mesh properties such as area, and reducing the complexity of meshes.
PyVista also provides some advanced filtering techniques like removing specific parts of one mesh and joining another mesh in that place. It provides ray tracing, meaning we can edit how the light interacts with the object. Additionally, it supports interpolating scalar or vector values and integrating vector fields to generate streamlines, enabling us to visualize how air or fluid flows around the object.
Lighting
Adjusting lighting in a visualization is very necessary, hence pyVista allows us to control lighting by letting us choose between preset lighting systems, custom light types, and more. We can disable light on the mesh level, or customize from which side the light should come. These advanced lighting techniques help users to create the best visualizations possible.
Widgets
PyVista provides many interactive widgets that we can use in our visualizations. These widgets help us render scenes to control filters like clipping, slicing, and thresholding. All these widgets can be customized using custom callback functions. Using these widgets, we can control the positions of meshes, use slider bars for various tasks, and even integrate multiple widgets into one visualization. These widgets help us perform common tasks in an easy and interactive way.
Installing PyVista
Before we install the PyVista library we need to install the Visualization Toolkit (VTK) in our system, as I told you, PyVista is built on top of VTK. Paste this below command in your terminal to install VTK.
pip install vtkWe can install this library in any of the following ways:
Installation via PyPI
To install it using PyPI, paste this below command in your terminal:
pip install pyvista['all']Installation via GitHub
To install it using GitHub, first clone the official PyVista repository using the command below, then run the next command in the cloned folder’s terminal.
git clone https://github.com/pyvista/pyvista.git
python setup.py install
Exploring Human Anatomy Visualizations with PyVista
We’ll explore various detailed 3D models of anatomical structures such as the brain, chest, foot, and the entire human body, showcasing PyVista’s powerful capabilities and ease of use.
Brain Atlas With Sides
In this visualization, we will create the brain’s anatomical structure, showing both the left and right hemispheres. This visualization can be used to understand the spatial relationships between different parts of the brain, making it useful in the field of medicine.
To create this visualization, we will first import the examples module from PyVista, which contains the brain dataset. Then, we will download the data by calling examples.download_brain_atlas_with_sides(). Finally, to view the visualization and open the PyVista interface, we will call the plot() function. We’ll set the volume parameter to True to fill the brain structure with colour and set the cmap parameter to ‘bone’ to get a grey-blueish colormap. When you run this program, the PyVista interface will open with the visualization, allowing us to interact with it and gain a deeper understanding of the brain.
from pyvista import examples

brain_atlas = examples.download_brain_atlas_with_sides()
brain_atlas.plot(volume=True, cmap="bone")
Output:
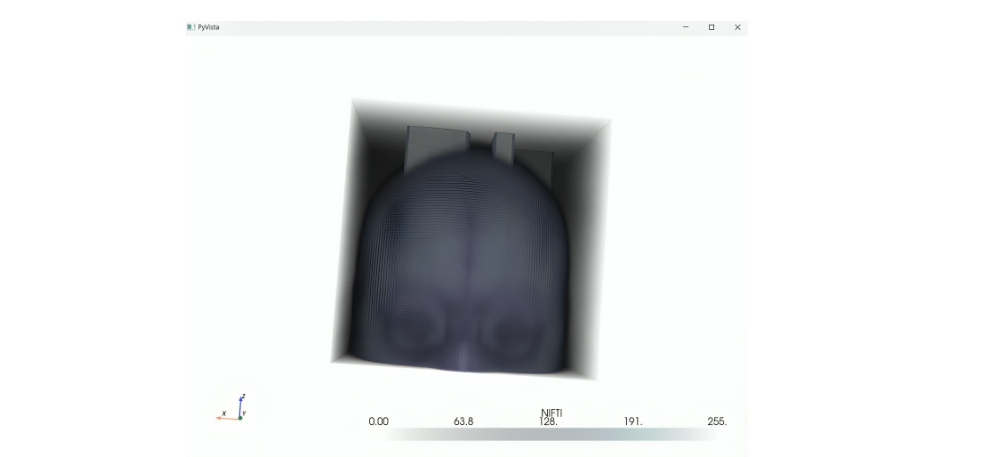
Chest Visualization
In this visualization, we will create a chest visualization, to examine the chest in a anatomical way. This could be helpful for medical education and diagnostic purposes. Just like the previous way, to create this visualization, we will first import the examples modules from the Pyvista library. We will then download the chest dataset by calling examples.download_chest(). Finally, to plot the visualization, we will call the plot() function in which we will pass the style parameter as surface and the background as white. When you run this code, you will get the chest visualization.
from pyvista import examples

chest = examples.download_chest()
chest.plot(style='surface', background='white')
Output:
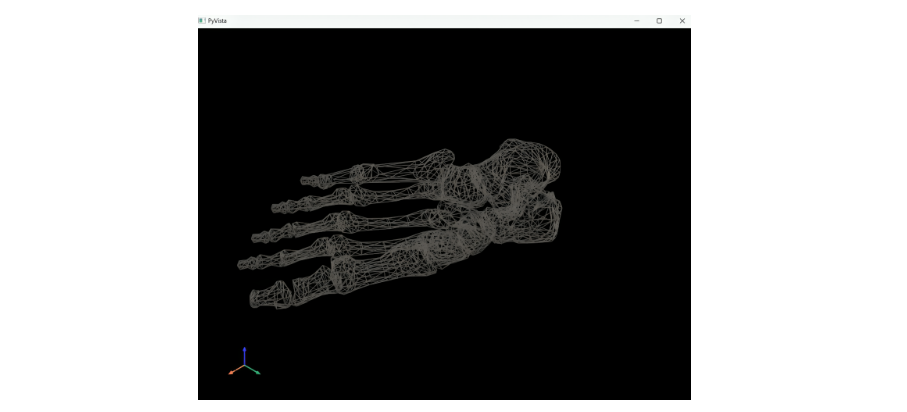
Foot Bones Visualization
The ‘Foot’ visualization provides a detailed view of the bones in the foot, allowing us to examine the structure and identification of any fractures. This makes it a valuable tool in the field of medicine.
To create this visualization, we will import the examples module from PyVista and download the data by calling examples.download_foot_bones(). Then, we will call the plot() function, setting the style to wireframe to visualize the bone structure, the background to black, and the bone colour to gray.
from pyvista import examples

foot_bones = examples.download_foot_bones()
foot_bones.plot(style='wireframe', color='gray', background='black', show_axes=True)
Output:
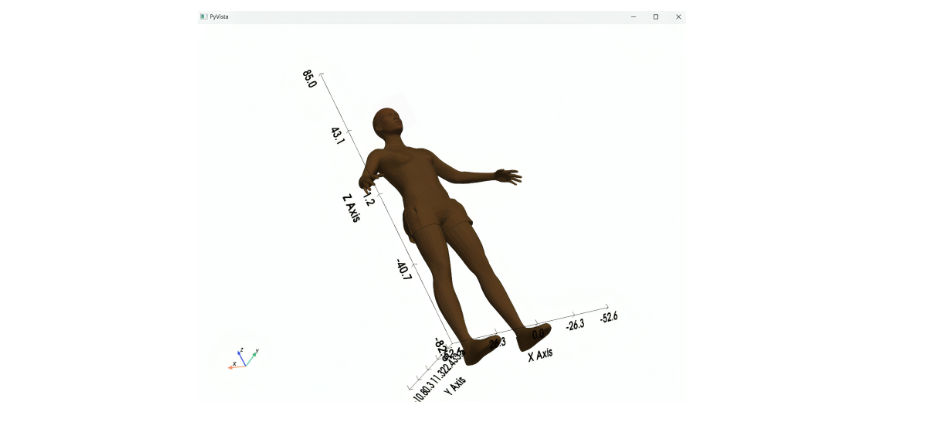
Whole Human Body Visualization
In this visualization, we will build an entire human 3d visualization, to examine the whole anatomical structure. To load and visualize this model, we follow a similar process to the previous examples. We will first import the examples module from PyVista and download the data by calling the examples.download_human() function. We can also create and import our own 3D dataset for visualization. Then, to plot the visualization, we will call the plot() function, set the style to surface, the human model color to brown, the background color to white, and enable the show_bounds parameter to display the x, y, and z axes.
from pyvista import examples

human = examples.download_human()
human.plot(style='surface', color='brown', background='white', show_bounds=True)
Output:
Advanced Visualization Techniques
We’ll now explore the advanced visualization techniques offered by PyVista, including volume rendering, custom opacity settings, shading, and interactive widgets. These techniques allow for a deeper and more nuanced examination of 3D models, enhancing clarity and providing richer insights into the visualized data.
Volume Rendering
Volume rendering is a powerful technique in PyVista that allows us to render complex structures within the human body, providing a detailed view of internal anatomy. This method enables us to adjust opacity and color mapping (CMAP) to gain deeper insights into the visualization.
To build this visualization, we will first import the examples module from PyVista, and then download the brain data using the examples.download_brain() function. Next, we will specify the camera position using cpos. Then, we will plot the visualization using the plot() function, specifying volume as True and colormap as ‘bone’, and importing the cpos. This code will create a detailed, interactive 3D brain visualization.
from pyvista import examples

data =  examples.download_brain()
cpos = [(-381.74, -46.02, 216.54), (74.8305, 89.2905, 100.0), (0.23, 0.072, 0.97)]

data.plot(volume=True, cmap="bone", cpos=cpos)
Output:
Sigmoid Opacity
The sigmoid opacity is a parameter in volume rendering that enhances the visibility of structures by increasing transparency, making it easier to identify and examine specific parts of the brain.
To apply this filter, first we will import the examples module, download the brain data, and specify the camera position just like above. Now we will create a plotter object from PyVista by calling Plotter(). Then we will use the add_volume() function to add the data, specify the colormap as ‘bone’, and set the opacity as ‘sigmoid’. Next, we will add the camera position (cpos) to the plot and use the show() function to display the plot. You can see the difference in brightness compared to the previous output.
import pyvista as pv
from pyvista import examples

data =  examples.download_brain()
cpos = [(-381.74, -46.02, 216.54), (74.8305, 89.2905, 100.0), (0.23, 0.072, 0.97)]

pl = pv.Plotter()
pl.add_volume(data, cmap="bone", opacity="sigmoid")
pl.camera_position = cpos
pl.show()
Output:
Custom Opacity
If we want a custom opacity for the visualization rather than predefined options like sigmoid, we can define a custom list of values for opacity. By defining a custom opacity transfer function, we can control our visualization to a new level.
To create this visualization, we will follow the usual steps: importing the necessary library, downloading the brain data, and defining the camera position. Then, we will define the opacity values in a list. Next, we will create a Plotter object and add the data using the add_volume() function, in which we will pass the data variable, set the colormap to ‘viridis’ to give shades of green to our brain, and pass the opacity variable to the opacity parameter. Finally, we will add the camera position (cpos) to the plot and use the show() function to display the plot.
import pyvista as pv
from pyvista import examples

data =  examples.download_brain()
cpos = [(-381.74, -46.02, 216.54), (74.8305, 89.2905, 100.0), (0.23, 0.072, 0.97)]

opacity = [0, 0, 0, 0.1, 0.3, 0.6, 1]

pl = pv.Plotter()
pl.add_volume(data, cmap="viridis", opacity=opacity)
pl.camera_position = cpos
pl.show()
Output:
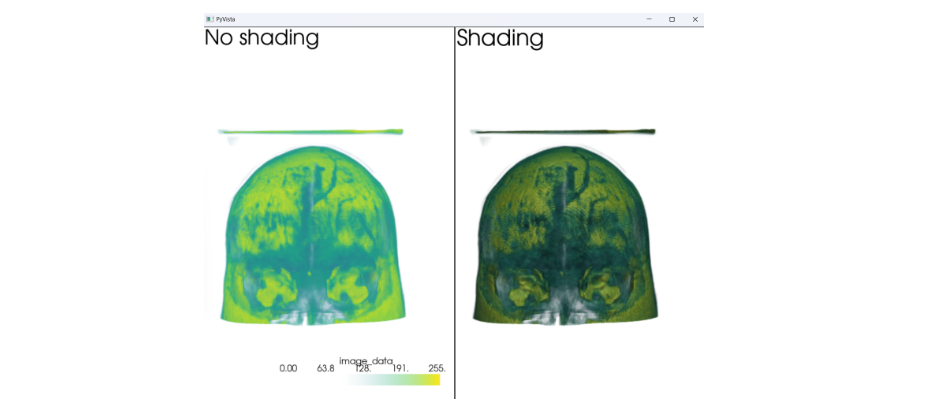
Shading
Shading is another important parameter of the volume function, using which we can enhance the depth and surface details by adding effects of light on the object’s surface. By adding shading, we can create a more realistic visualization, making it easier to examine our visualization.
In this example, we will create two plots: one with shading and another without shading. A great feature of PyVista’s visualizations is that interacting with one plot will synchronize the movements in the other, allowing us to visualize both plots in the same region simultaneously.
To create this visualization, we will first create a normal visualization of the brain without shading. For this, we will follow the same process as above. Additionally, we will use the add_text() function to add a title. For the first plot, the title will be “No Shading”. Then, to create a second plot, we will call the subplot() function and add the volume with shading by setting shade=True. Finally, we will use the link_views() function to link both plots, allowing synchronized interactions. We will view the plots using the show() function.
import pyvista as pv
from pyvista import examples

data =  examples.download_brain()
cpos = [(-381.74, -46.02, 216.54), (74.8305, 89.2905, 100.0), (0.23, 0.072, 0.97)]

opacity = [0, 0, 0, 0.1, 0.3, 0.6, 1]

pl = pv.Plotter(shape=(1, 2))
pl.add_volume(data, cmap="viridis", opacity=opacity, shade=False)
pl.add_text("No shading")
pl.camera_position = cpos

pl.subplot(0, 1)
pl.add_volume(data, cmap="viridis", opacity=opacity, shade=True)
pl.add_text("Shading")
pl.link_views()
pl.show()
Output:
Visualizing Custom Data
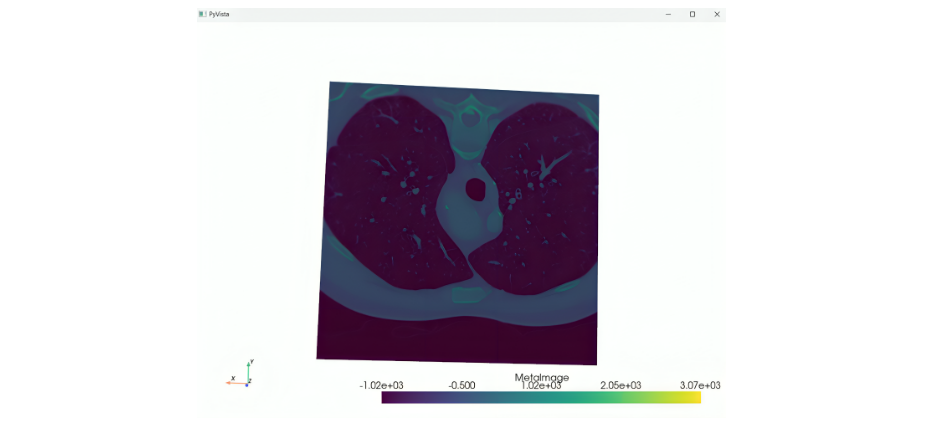
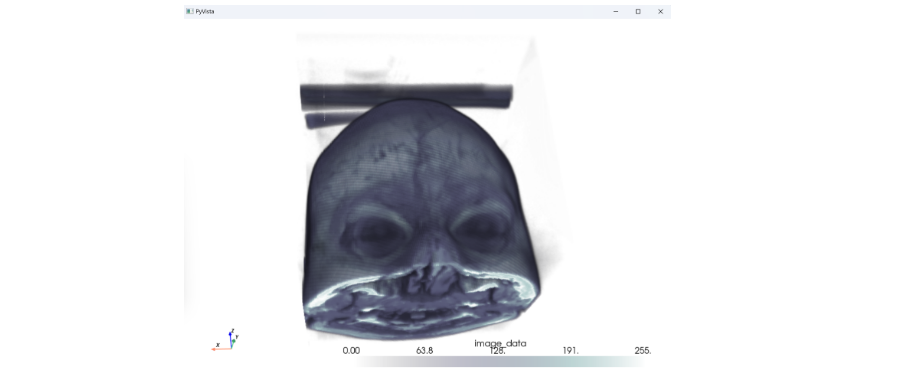
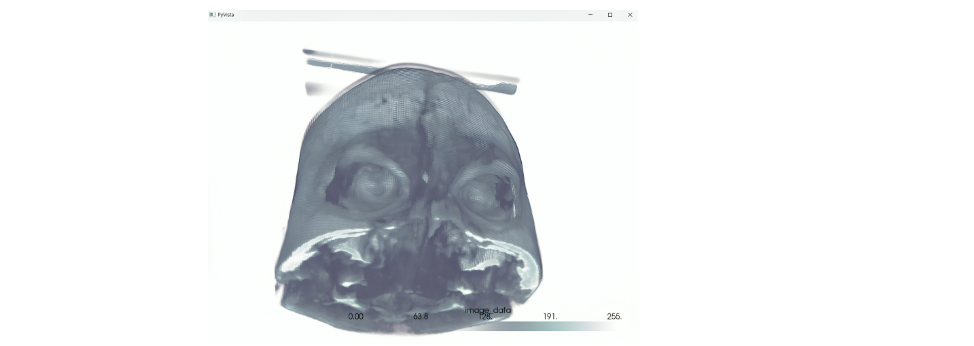
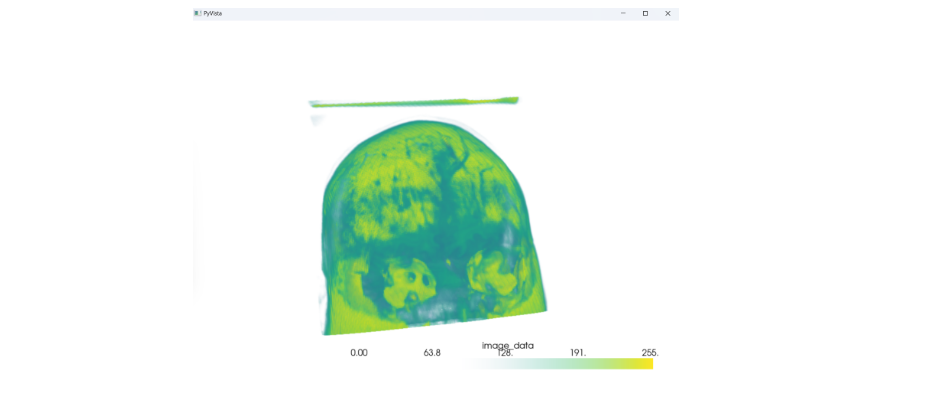
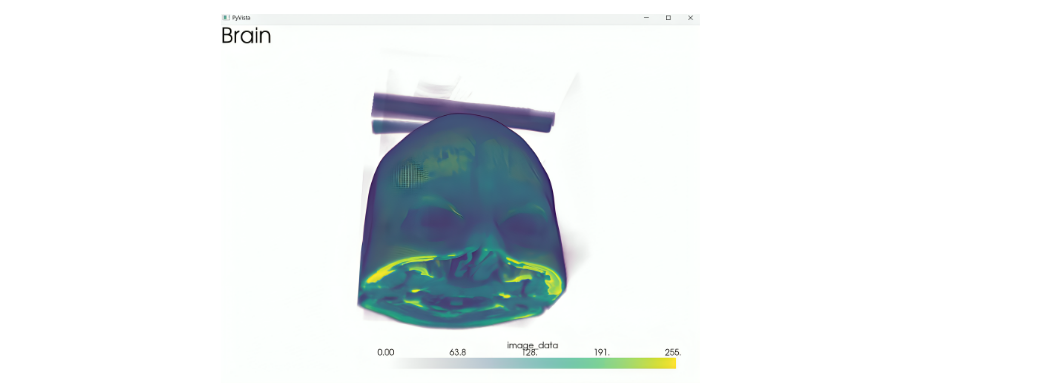
Doctors can use PyVista to visualize their patient’s medical data to identify if there are any abnormalities or damages. By using the volumetric rendering technique, doctors can create detailed 3D models of their patient’s medical imaging data from formats such as .vtk, .vti, or .nii.
In this example, let’s load a patient’s brain data to see if there are any damages. First, we will import the PyVista library with an alias as pv, then we will call the read() function of PyVista to load the medical image data from a file. In this example, we will use a brain.vtk file (https://github.com/pyvista/vtk-data/blob/master/Data/brain.vtk). Next, we will create a Plotter object and add volume to the brain data using the add_volume() function. After adding a title, we will call the show() function to visualize our data.
import pyvista as pv

data = pv.read("C:\\Users\\ananyasm\\Desktop\\pyVista\\brain.vtk")

pl = pv.Plotter()
pl.add_volume(data)
pl.add_text("Brain")

pl.show()
Output:
Conclusion
In conclusion, PyVista is an excellent 3D visualization Python library. It offers a clean interface that allows users to create and render complex visualizations with minimal code. PyVista provides many built-in datasets that can be used to create visualizations instantly. In this blog, we focused on utilizing the medical examples and datasets available in PyVista, creating different anatomical visualizations such as the brain, chest, foot, and the whole human body. We then explored various filters available, which can be customized using parameters with the brain example. By now, you should have a good understanding of the basic procedure to create any visualization using PyVista. So, next time you want to visualize a 3D plot, do try PyVista.
Key Takeaways
- PyVista provides a user-friendly interface for creating complex 3D visualizations with minimal code.
- It offers different modules such as Mesh Creation, Filtering, Lighting, Widgets, etc.
- PyVista’s built-in datasets make the process of creating detailed 3D visualizations easy.
- It provides many customization techniques like volume rendering, shading, and opacity adjustments to enhance the clarity and detail of 3D models.
Frequently Asked Questions
Q1. What is the advantage of using custom opacity in PyVista visualizations?
A. Having the ability to add custom opacity to our visualizations helps us control the transparency of the visualization, enhancing the clarity and detail.
Q2. What are some examples of anatomical structures you can visualize using PyVista?
A. We can create visualizations of the brain, chest, foot, whole human body, torso, knee, and many more.
Q3. Can you create common 3D objects in PyVista?
A. Yes, we can create common 3D objects such as cubes, spheres, arrows, and many more.
Q4. What are some ways to adjust the lighting in PyVista visualizations?
A. PyVista allows us to choose between preset lighting systems, custom light types, and we can control the direction and intensity of the lights.
The media shown in this article is not owned by Analytics Vidhya and is used at the Author’s discretion.
Passionate about Data. Third-year CSE(Data Science)student at Presidency University, Bangalore.
Working as an AI/ML developer at Google Developer Student Clubs - Presidency University Bangalore, with a great team. When I am not studying I usually spend my time reading novels.


