Introduction
Tableau is a powerful and advanced visualization tool. It covers the whole visual development lifecycle. Starting with Tableau Prep Builder, you can effectively clean, transform, and source data under one roof. Tableau Desktop then presents this data to tell a story, while Tableau Server allows you to share these visuals with the intended audience. In this whole process, the interpretation of the dashboard requires a manual effort. From the creator’s point of view, the dashboard presents a perfect trend such that it grasps all the eyeballs but from a viewer’s perspective, it might take some time to understand the dashboard. The viewer will require a walkthrough of the charts, and figures and then draw some conclusions. To streamline this process, integrating Google Gemini into Tableau can enhance dashboard comprehension by leveraging AI-driven insights, reducing the time required to interpret data.
What if the viewer gets an AI helper to figure out the charts and figures themselves? Introducing LLMs. Since the introduction of GPTs and large language models (LLMs), many manual workflows, such as chatbots, translations, and research, have shifted to AI agents. Data Analysis is one such sector that is gradually sliding to AI agents. These agents can take up automated data wrangling, anomaly detection, feature selection, or predictive analytics. In this guide, we will explore how to integrate Google Gemini into Tableau dashboards. Ask it to give data summaries, predictions, conclusions, and more.
Learning Objectives
- Discover how to expand your dashboard functionality with Dashboard Extensions.
- Understand the toolkit for setting up Gemini in Tableau Dashboards.
- Explore how to leverage Python to interact with the Tableau Dashboard and send information to and from the dashboards.
- Learn how to enable users to ask questions about graphs and figures and get responses in the same window.
- Recognize the potential security risks of sending sensitive information to LLMs.
This article was published as a part of the Data Science Blogathon.
Table of contents
What are Dashboard Extensions?
Adding an external service to an already fully-fledged application is a hard task. Tableau is a fairly large application and it is nearly impossible to code out a new feature without having access to all the codebase and the dependencies. Therefore we have Tableau Dashboard Extensions. Dashboard Extensions are web apps that can be incorporated into a dashboard like other dashboard components. These web apps interact with Tableau internals using Tableau Extensions API. On a high level, these apps can be divided into two types:
- Network-enabled: These apps run on servers located outside the Tableau environment. The app can be hosted on any platform and the client-side code is embedded directly into Tableau via the extension file (trex).
- Sandboxed: The sandboxed apps run in a protected environment with limited or no access to resources or web services. Usually developed by the Tableau team, they have limited capabilities yet are powerful in enhancing dashboard interactivity.
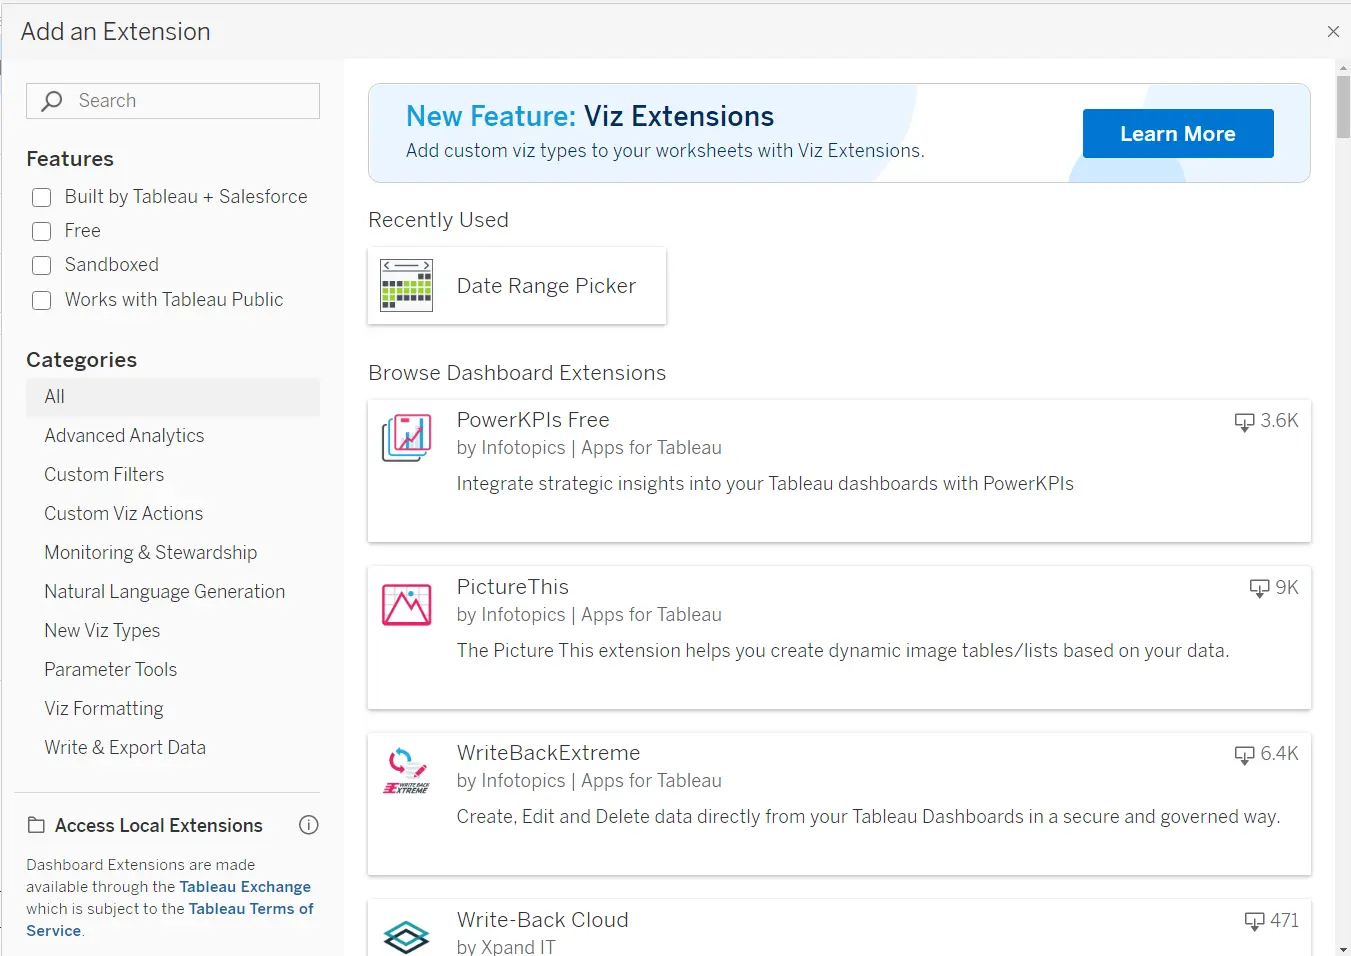
There is a whole library of Dashboard Extensions available on the Tableau Exchange. Some are officially developed by the Tableau and Salesforce teams and more by well-known firms. The extensions are a great way to extend the functionality of a base dashboard and make it more interactive. There are extensions to export data from the charts, add new information to the dashboards, or edit the existing data!
For our use case, we will build a Dashboard extension where a user selects data points on the dashboard, submits a question, sends all this information to Gemini for analysis, and displays the results in the same window.
Setting up the ToolKit for Dashboard Extension Development
Dashboard Extensions uses the underlying Tableau Extensions API to interact with the Tableau dashboard’s internal objects. This JavaScript library API can limit the Python developer’s skills. To overcome this, we will use Anvil. Anvil is a platform for building full-stack web applications in Python. It has an open-source library called trexjacket that allows developers to interact with the dashboard internals using Python. The Anvil sits as an interface between Tableau JavaScript APIs and the Python code from the user side. The trexjacket provides the Tableau dashboard access via Python and the workflow continues.
For our Dashboard Extension that works with Google Gemini, we need the following:
- Gemini API Access
- Anvil project preconfigured with trexjacket
- Tableau Application and a Dashboard
Gemini API Access
Google has released API access to Gemini, previously known as Bard under a sub-vertical called “Google AI for developers”. One can explore Gemini API, Google AI Studio, Gemma models, and Google AI Edge. The API access is still provided via the Google Cloud Project (GCP). Head to Gemini and click the “Get API key in Google Studio” option. Clicking “Create API key” will prompt two options, create a new project or add API access to an existing project.
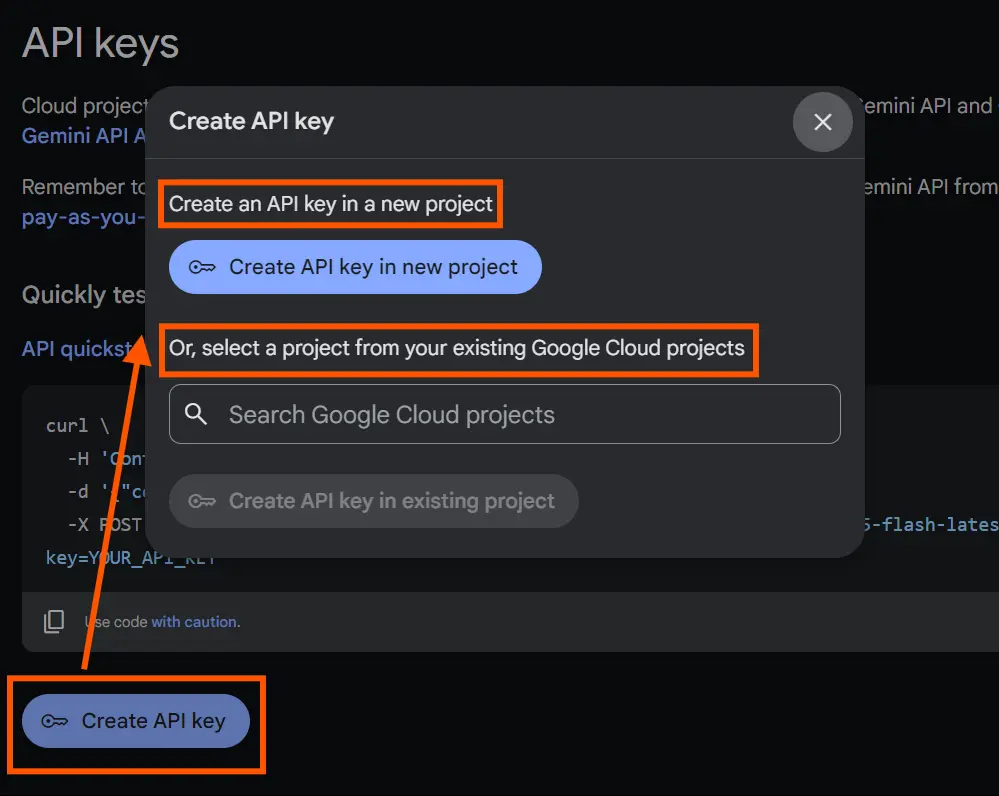
Choose any option and keep the API key in a safe place.
Anvil Project with Trexjacket
Anvil is a powerpack platform offering full-stack web development in Python. The main differentiator is building the frontend in Python and effectively stitching it to the backend server code. The design organizes the whole application in an object-oriented programming paradigm, facilitating easier access and management of different components in the web app. It also allows modifying the underlying makeup files, HTML, CSS, and JS for more granular control over the user interface.
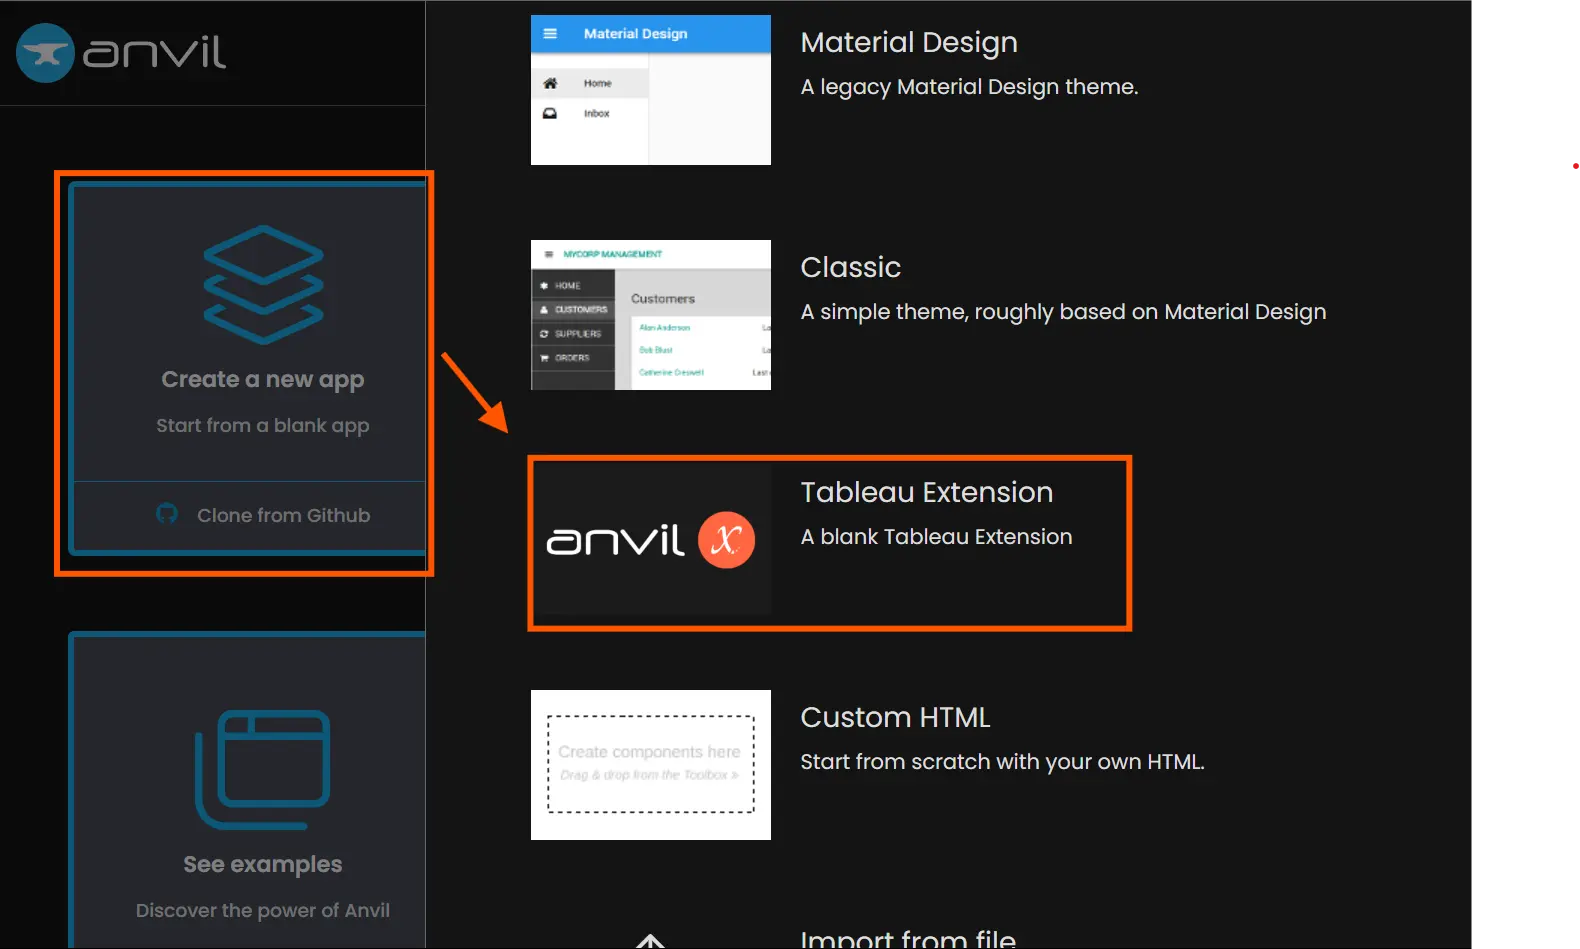
Anvil has built a template project preconfigured with trexjacket that fast-tracks the Dashboard extension development under Anvil X. This template has the configuration set for trexjacket as a dependency for the Anvil app. To set up a project with trexjacket as a dependency, sign up for an account on anvil.works, select “Create a new app” and select “Tableau Extension”.
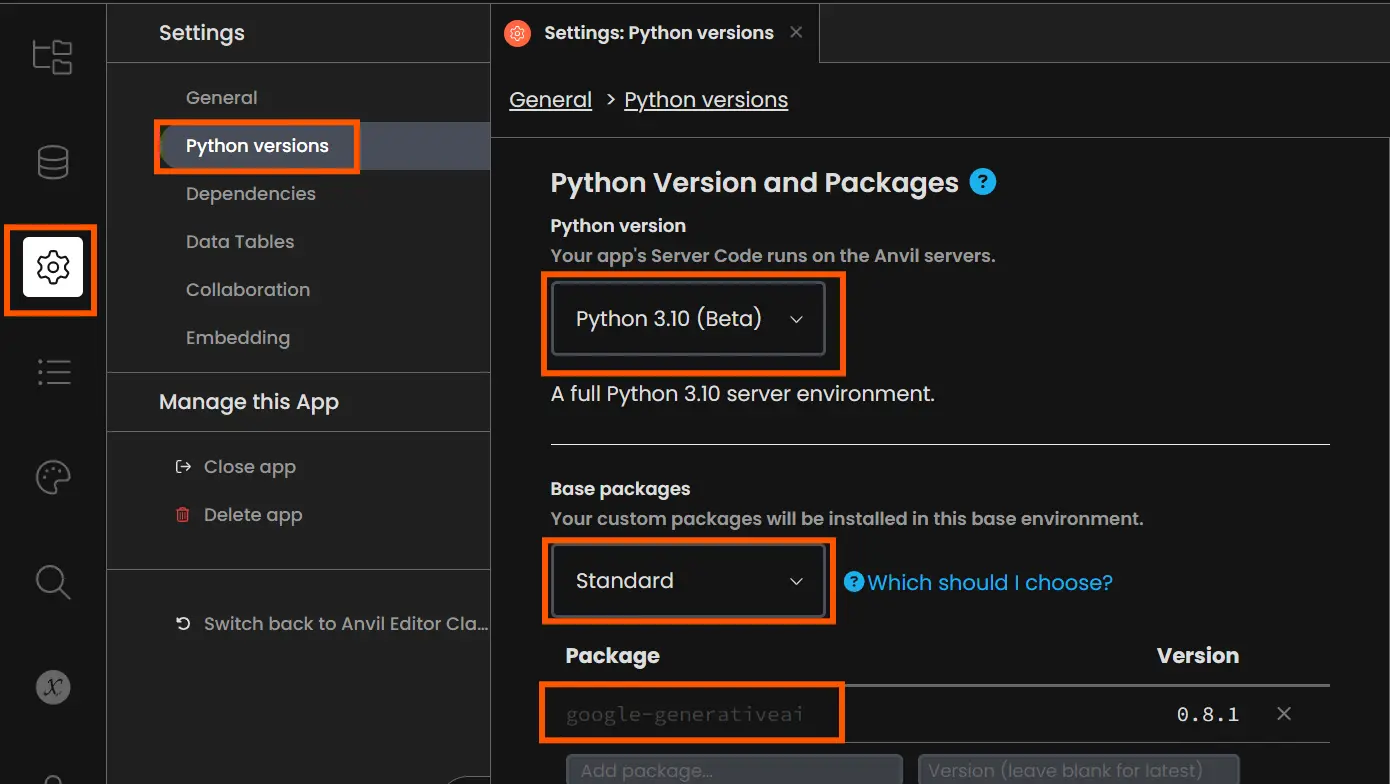
In the template app, you can delete the configure settings, and startup module and clear up the design page of the app as these are not needed for our use case. Next, we need to add the Google Generative AI Python library in the Anvil environment. For that, go to settings from the left, select Python versions, switch to Python beta, select the base package as standard, and add the package name as “google-generativeai”
For the scope of this guide, we will not explore Anvil basics and cover only the required sections of Anvil. If you want to deep-dive into Anvil as a tool, check out my other article Frontend, Backend & Database Using Python: Anvil.
Tableau
Tableau Dashboard extensions support both desktop and server/cloud instances, as well as Tableau Desktop Public and full-suite applications. We will use Tableau Desktop Public to test the extension in our use case. The next thing we require is a working dashboard. You can pick any dashboard of your choice for testing purposes. I am using a dashboard published on Tableau Public about the Paris Olympics 2024.
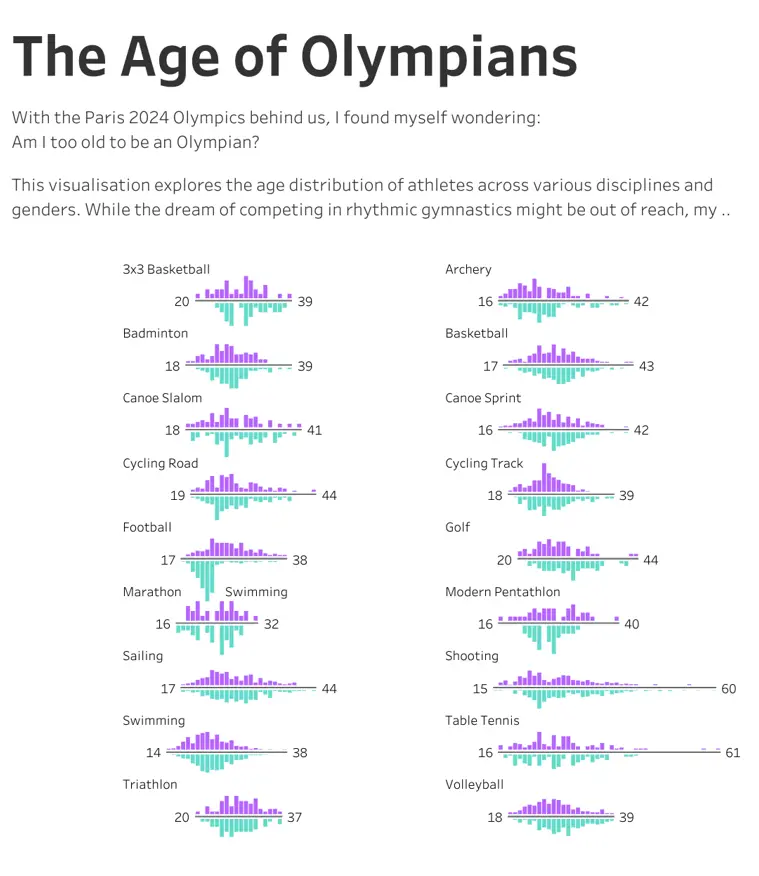
Note: The author of this dashboard mentions the dataset is from the Paris 2024 Olympic Games Dataset in Kaggle.
Tableau Dashboard and Anvil Connection Setup
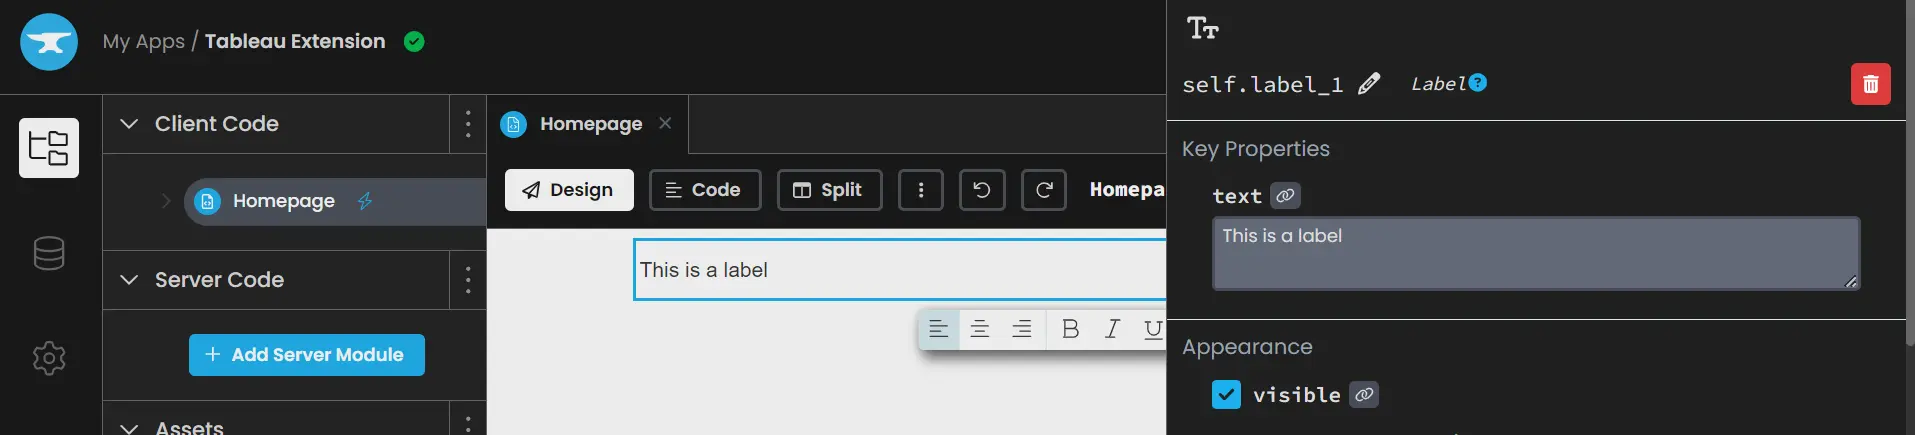
Let’s create a dummy extension to establish the connection between the Tableau Dashboard and the Anvil. In the Anvil app, drag a label from the add component option to display some text. Upon clicking this label, we can change the label display text and tweak other properties such as font, color, and size.
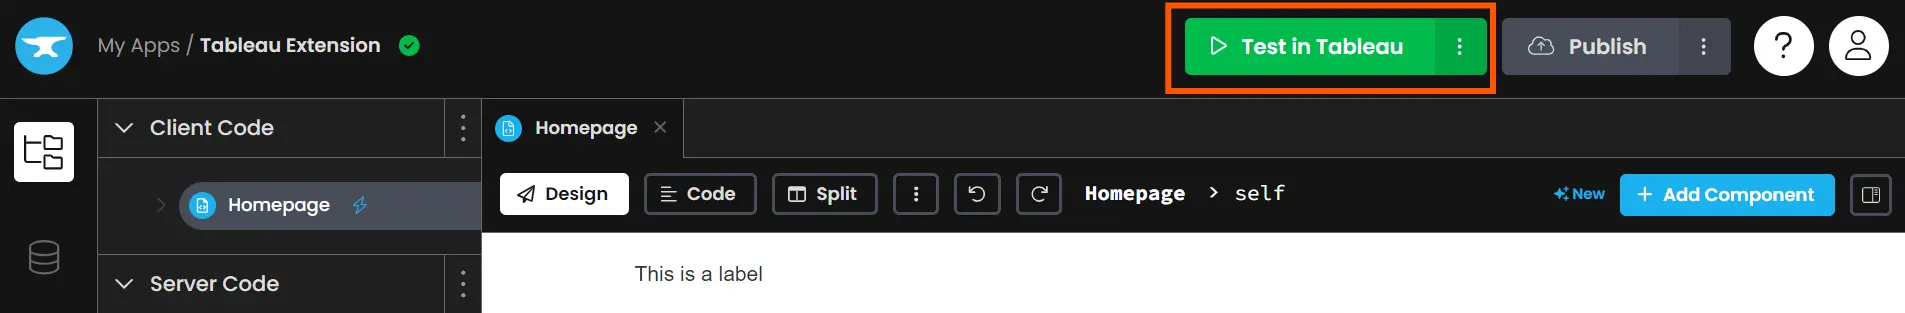
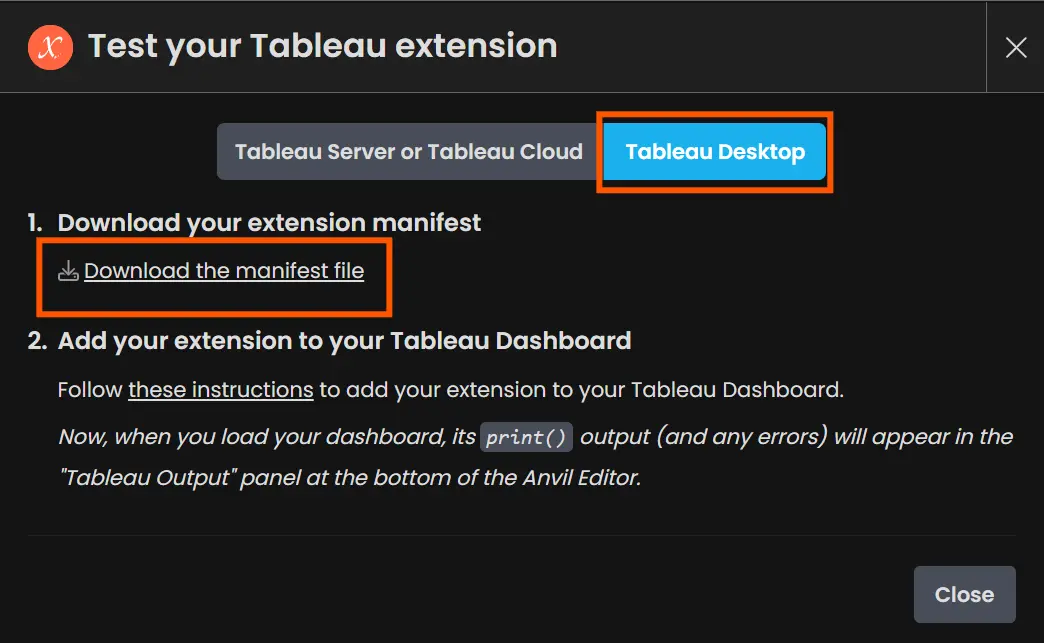
Next, from the top of the app, click “Test in Tableau” and download the manifest file. This file has the “trex” extension and can be loaded as a local extension in the Tableau Dashboard. You can choose to keep the dashboard in Tableau Desktop for now and later publish it on the server. The server configuration for that will be mentioned in the popup.
Now drag an extension object into the Tableau dashboard and click “Access Local Extensions”. Here select the manifest file generated by Anvil.
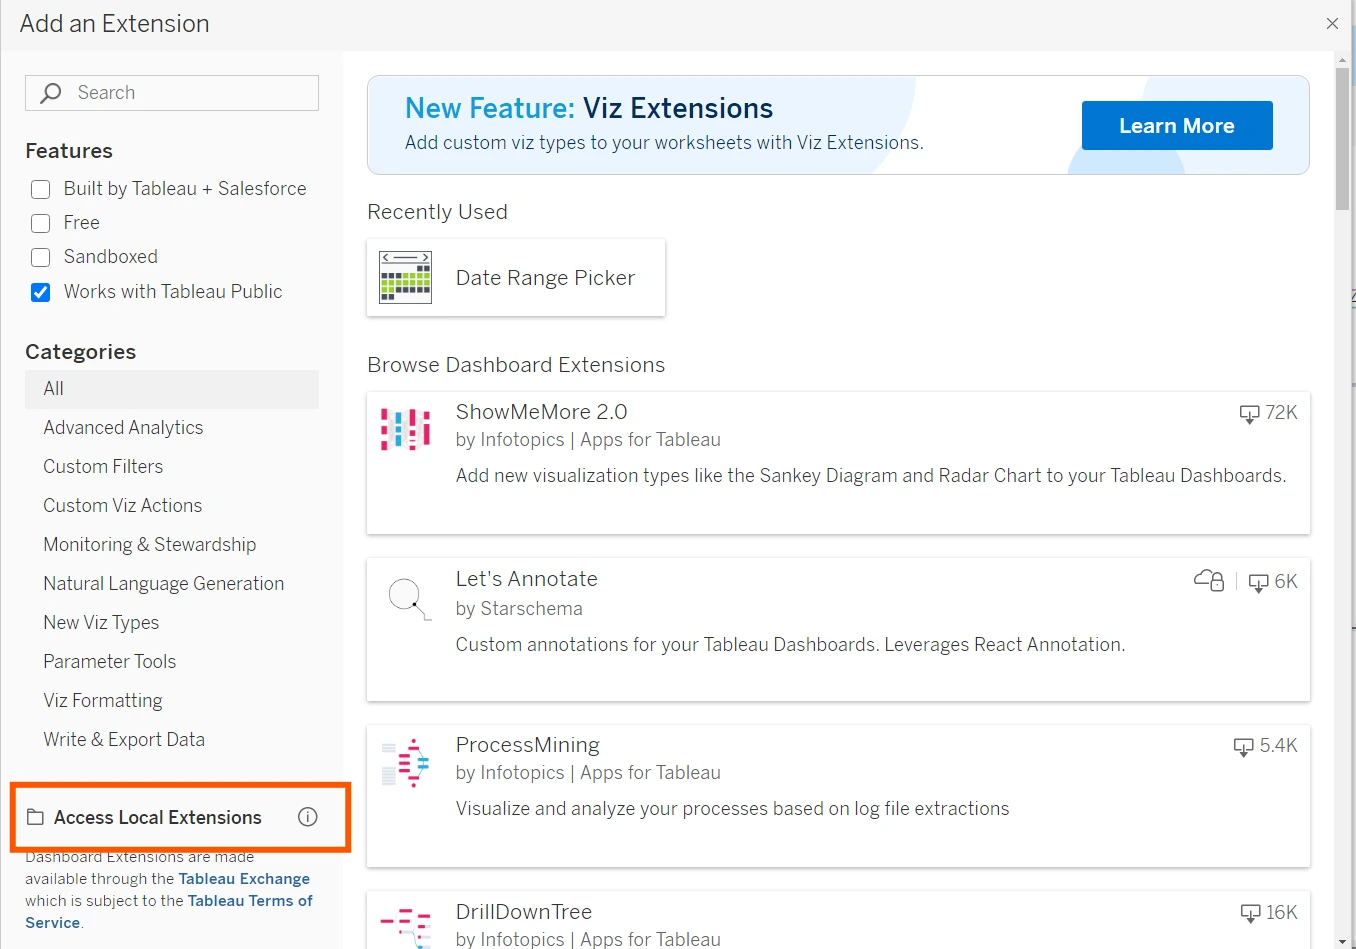

This extension will interact with Anvil to process the data we send from the Tableau dashboard and therefore falls under the network-enabled category of Dashboard extensions. Select “Ok” when prompted to allow access to the extension. The Anvil App will load in the window, establishing our connection between the Tableau Dashboard and the Anvil server! We can start adding components to this app and stitch the Gemini API.

Building the Extension UI
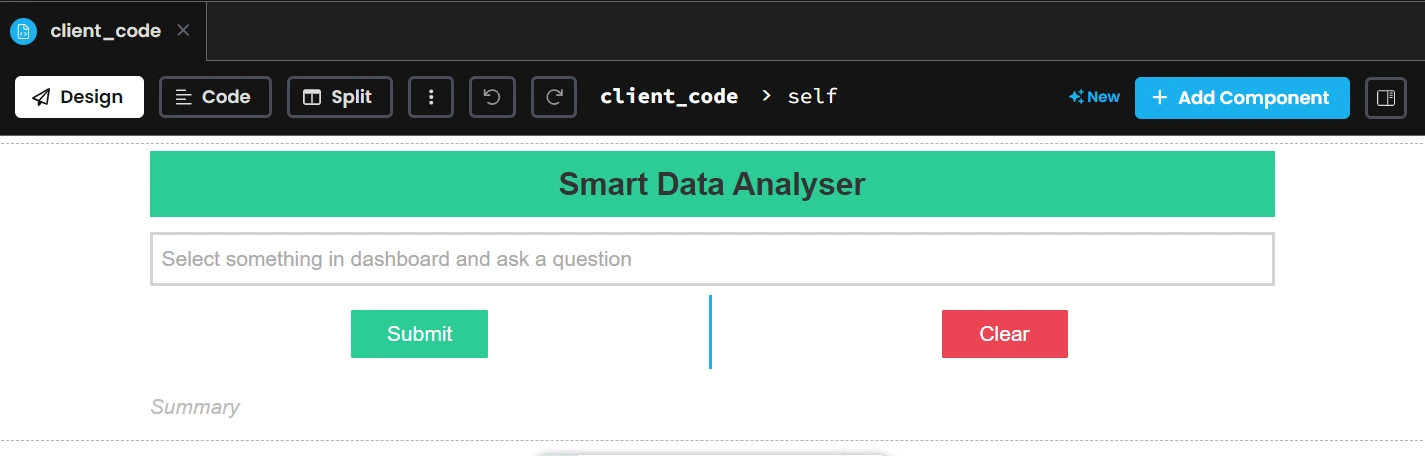
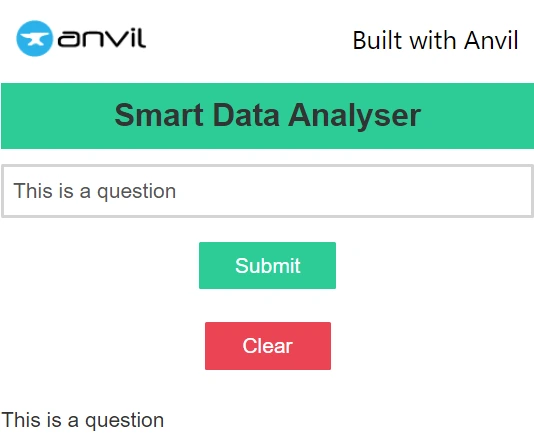
Anvil provides drag-and-drop functionality for designing the user interface of the application. There are various components available in the library to choose from. For our use case, the design breakdown looks like this:
- Input box (TextBox) for taking the user question
- Submit button for sending the data to Anvil and Clear button to clear the question and the analysis text
- A summary label placeholder will display text that the Gemini API replaces with the results.
- A title, colors for submit and clear button, and text colors to improve user experience
- You can add the placeholder texts and display names by clicking on the component, opening the properties panel, and modifying the required attributes.
Below is the design we will be using for this extension:
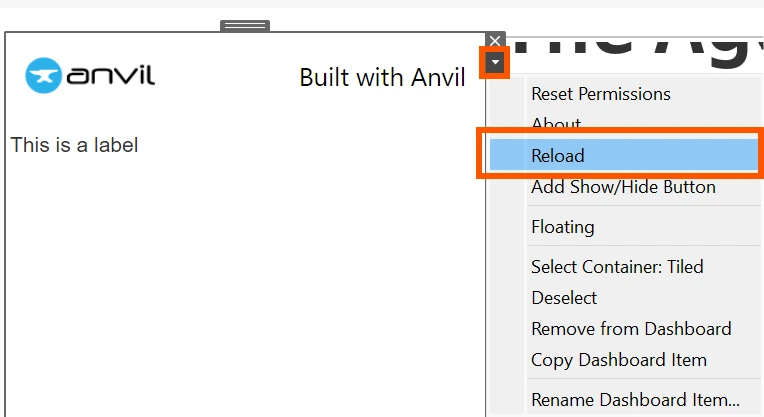
The best part about network-enabled extensions is the ability to deliver changes to the end user without any reinstallation. We can see the updated UI directly in the dashboard without regenerating the manifest file. Click on the extension object, select the dropdown, and click “Reload”. This will update the extension in real-time.
We need to provide object names to these UI components to stitch them together, change their state in the coding part, and make them functional. To do that, open the component properties panel and add the name in the “self”. As you can guess, these components will be available as objects on our main screen. The names provided for this extension are:
- TextBox: user_question
- Submit Button: btn_submit
- Clear Button: btn_clear
- Summary Label: summary
Coding the Logics for Extension
In Anvil, client-side coding manages the user interface and handles all UI interactions, while holding less secure coding elements. Since the client code runs in the web browser, it has limited capabilities for processes at the browser level. On the other hand, server-side coding manages tasks like authentication, password checks, and maintaining database connections.
In our case, the client code can handle all the dashboard interactions and pass this data to the server code to prepare and send to the Gemini. The Gemini API needs to be accessed securely and will require server-side coding there. Let’s start setting up the client-side coding and then move to the server side.
Accessing Dashboard and Stitching UI
To switch to the coding part of the UI, select the “Code” tab from the top. The system populates it with some boilerplate code to get things started. You can remove things like registering event handlers and the config page at startup for now. Use the code below as a starting point to follow along.
from ._anvil_designer import client_codeTemplate
from anvil import *
import anvil.server

from trexjacket.api import get_dashboard
dashboard = get_dashboard()

class client_code(client_codeTemplate):
  def __init__(self, **properties):
    self.init_components(**properties)
The system automatically imports and initializes the trexjacket as a dashboard object named “dashboard,” which serves as the entry point to access all the dashboard interactions. We can register 3 types of interactions from the dashboard: selection, filter & parameter change. To register an event type, we need to use the register_event_handler function of the dashboard object. It takes the event type and the handler function as the arguments. The handler function takes care of the part when the event is triggered. This function can access the event metadata, worksheet, and underlying data.
In our case, the selections done in the dashboard need to flow through our extension. Next, to get the selected data point values, we can use the handler function’s event worksheet object to call the get_selected_marks function and store it to pass the data to the backend. For demonstration, let’s change the display value of the summary component to show the selected values. To do that, we can modify the text property of the component to take the value as the selection.
Code Implementation
Here is the code implementation:
class client_code(client_codeTemplate):
  def __init__(self, **properties):
    self.init_components(**properties)
    dashboard.register_event_handler('selection_changed', self.selection_changed_event_handler)

  def selection_changed_event_handler(self, event):
    user_selections = event.worksheet.get_selected_marks()

    if len(user_selections) != 0:
      self._data = user_selections
      self.summary.text = user_selections
Next, we need the Submit and Clear buttons functional. You can view the type of events supported for any component by selecting the component and switching to the properties panel. The events section will list all the events along with their function mappings. For buttons, we need to map the click event to do some operations.
- Clear button: We need to clear the question box, summary section, and the data stored for previously selected marks
- Submit button: The text in the question box needs to be sent to the Gemini API.
The intended work of the submit button will be discussed in the next section. For now, let’s replace the summary text with the question text upon clicking the submit button.
Code Implementation
The code implementation is as:
class client_code(client_codeTemplate):
  def __init__(self, **properties):
    self.init_components(**properties)
    self.summary.visible = False
    dashboard.register_event_handler('selection_changed', self.selection_changed_event_handler)

  def selection_changed_event_handler(self, event):
    user_selections = event.worksheet.get_selected_marks()

    if len(user_selections) != 0:
        self._data = user_selections

  def btn_submit_click(self, **event_args):
    """This method is called when the button is clicked"""
    self.summary.visible = True
    self.summary.text = self.user_question.text

  def btn_clear_click(self, **event_args):
    """This method is called when the button is clicked"""
    self.summary.text = ''
    self.user_question.text = ''
    self._data = ''
    self.summary.visible = False
Adding Gemini API Backend
Our UI is ready to accept the user inputs and the components are stitched together. Now we can add the brain of our application, the Gemini API access to process these user inputs. The following pointers describe our next steps:
- Server module: To add server-side coding to the application, click on 3-dots in the server code section on the left and select “add server module”.
- Secrets: We should store the Gemini API access key in a secure place to prevent unauthorized requests. Anvil Secrets is a secret manager where we can add keys, passwords, or credentials and access them in our code using the Anvil secret module.
- Pre-configure Gemini API: Although Gemini like any other LLM can process any information, we can provide pre-context to Gemini. This context will help us get more refined responses and focus on our use case. We can pass these instructions while initializing our model object.
The code part for the above explanation goes like this:
import anvil.secrets
import google.generativeai as genai

GOOGLE_API_KEY = anvil.secrets.get_secret("GEMINI_API")
genai.configure(api_key=GOOGLE_API_KEY)
model = genai.GenerativeModel(model_name='gemini-1.5-flash', system_instruction=[
        "You are an expert analyst and know everything about data analysis",
        "You can interpret data in any form whether it's a single data point or a list of data with keys"
        "You are on a mission to provide the best data analysis report when asked",
        "You are capable of answering the question without report as well on topics that require you to answer between a finite set of possibilities",
    ],)
Next, we need to create a function that accepts the question and the data from the client, processes the information, and returns the resultant values. We expose this function to the client-side code to allow it to make calls. We use the Anvil callable decorator to wrap these functions and make them callable from the client-side code.
Final Function in Server Module
Here is our final function in the server module:
@anvil.server.callable
def generateDataSummary(prompt, data):
  revised_prompt = f'''
  {prompt} + "\n\n" + {data}
  '''
  response = model.generate_content(revised_prompt)
  return response.text
The last step in building our dashboard extension is to call this function, provide the user inputs, and display the results returned by Gemini API when the user selects some data points and clicks on the submit button. To achieve this, we need to use the anvil server module call function.This function takes the function name exposed as callable in the server module and accepts the parameters as keyword arguments. Additionally, we can add a notification for user acknowledgment using the Notification module. This implementation is done as:
class client_code(client_codeTemplate):
  .
  .
  def btn_submit_click(self, **event_args):
    """This method is called when the button is clicked"""
    msg = "Wait"
    Notification(msg).show()
    self.summary.text = ''
    dataSummary = anvil.server.call('generateDataSummary', prompt=self.user_question.text, data=self._data)
    self.summary.visible = True
    self.summary.text = dataSummary
    self._data = ''
Testing out the Extension
Our extension is ready to take inputs from dashboards, process them in Gemini, and return results in the same window! Reload the extension in the dashboard, select some data points, input some questions, and hit submit to see the results.

Check out this demo video to see things in action:
Potential Security Risks
We have successfully created a Tableau Dashboard extension that seamlessly integrates into the dashboard. This extension can be added to any dashboard without any issues. The only concern with using an LLM could be the sensitivity of data. Datasets such as financial, personal health, confidential, or proprietary information might require additional security measures and data anonymization/redaction techniques to ensure privacy and compliance. Although LLM provider companies such as OpenAI provide some flexibility not to allow the data training of the model. It might change depending on your firm and one should consult the infosec team before implementing such solutions.
Conclusion
In this guide, we saw how to integrate Google Gemini into Tableau Dashboards on a deeper level. The response quality depends on how the question (prompt) is provided. Many improvements can be made to the extension such as adding a configuration page to provide options for selecting the model to be used, updating system instructions, preprocessing the data to be sent, and much more.
On the trexjacket side, you can explore other functionalities such as accessing the filters and parameters or directly accessing the underlying data for a worksheet. The documentation is the best place to check these functions. One can develop extensions natively in JavaScript as well but it is a learning curve for the Python community, therefore, leveraging Anvil.
You can explore the code and resouces used in this article on GitHub.
Key Takeaways
- Tableau Extension is a great way to make the most of your dashboards. There are tons of extensions for a variety of use cases such as visualization extensions for adding Sankey flow charts which are not natively supported at the time of writing.
- One can use Gemini, an LLM, to demo the dashboard extension, but it’s also possible to use any LLM, a fine-tuned version, or a data specialist LLM for practical purposes.
- Integrating an LLM in your dashboards can free an analyst from answering some of the repetitive queries and focus more on taking action.
- One should also be aware of the potential data leakage and use such systems in moderation by avoiding passing on sensitive information.
Q1. What are Tableau Extensions?
A. Tableau Extension is a way to add functionalities to a dashboard that is not natively shipped in Tableau software. There are extensions to export data from a dashboard, add checkboxes in parameters, advanced date pickers, and much more.
Q2. What is the role of Anvil and trexjacket?
A. Anvil provides the platform to build full-stack web applications only using Python. This allows us to create the Tableau Extension UI without thinking of handling the JavaScript. Trexjacket provides an abstraction over dashboard elements and ways to access them programmatically.
Q3. How to add an Extension to a dashboard?
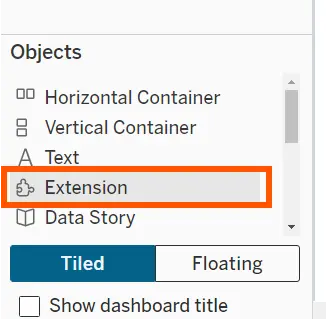
A. In the dashboard objects, drag the Extension object in the dashboard sheet and it will open a popup. Here you can choose from already published extensions or load your custom-build extension.
Q4. What are the types of interactions that can be captured using trexjacket?
A. Selection, filters, and parameters interactions can be captured using trexjacket
Q5. Can I use ChatGPT API instead of Gemini?
A. Yes, as long as you expose the LLM as an API endpoint, you can choose any LLM and integrate it into your Tableau Dashboards.
Q6. How can I integrate Google Gemini into Tableau?
A. You can integrate Google Gemini into Tableau by using API endpoints to enhance dashboards with AI-driven insights and event management.
The media shown in this article is not owned by Analytics Vidhya and is used at the Author’s discretion.
Kaustubh Gupta is a skilled engineer with a B.Tech in Information Technology from Maharaja Agrasen Institute of Technology. With experience as a CS Analyst and Analyst Intern at Prodigal Technologies, Kaustubh excels in Python, SQL, Libraries, and various engineering tools. He has developed core components of product intent engines, created gold tables in Databricks, and built internal tools and dashboards using Streamlit and Tableau. Recognized as India’s Top 5 Community Contributor 2023 by Analytics Vidhya, Kaustubh is also a prolific writer and mentor, contributing significantly to the tech community through speaking sessions and workshops.


