In my previous article, we discussed how to use Qlikview for visualization of tabular information. Now, let’s think of a scenario, where we need to represent location wise sales for a company running operations in India.
We can represent this information in many ways – tabular format, graphical representation or representation on geographical maps. Let’s have a look at each of these representations and see why should we represent information on Geo-Map?
A few key benefits of using geo-spatial visualization are:
- We can easily understand the distribution of Organizations presence across the country.
- Easy to represent high number of locations compare to tabular or graphical representation
- More intuitive decision making for the business owner.
Due to these benefits, there has been a marked increase in geo-spatial visualizations. Almost all BI tools have started offering this visualization as a standard option (e.g. Qlikview, Tableau, SAS Visual Analytics etc.).
When I started using Qlikview a years back, I wanted this visualization to be part of the dashboards I prepare, but i was unable to find a nicely structured tutorial around it. Hence I thought to contribute this article for the benefit of other analysts like me, who are struggling with similar question.
[stextbox id = “section”]Steps to represent information on Google Map:[/stextbox]
- Load base data (with Latitude and Longitude of location).
- Generate Google Map Variables
- Create a Scatter plot and configure Google Map
[stextbox id = “section”] Loading the base data with the Latitude and Longitude of Location:[/stextbox]
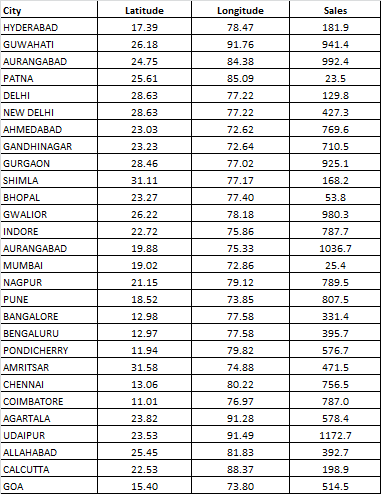
Following is the excel file used for this tutorial. Load this in Qlikview:
Make sure that Latitude and Longitude variable names are in lower case, as google map variable gets generated based on lower case only.
[stextbox id = “section”]Generate Google map variables:[/stextbox]
Create another tab in script (File -> Edit Script. Then in new window Tab .> Add New). The paste the following code to generate Google Map variable.
[stextbox id = “grey”]
// Google Maps Key
// get a key here http://code.google.com/apis/maps/signup.html
gmap_key = 'ABQIAAAAPTYGDOAE5g8mVF5kIaY54RSHwNu1JdqUbdjDP-YY4oym4d2mTxSRdsISI-1rwwnl-9gjJrMO3oTkMA';
max_zoom_level = 5; //maximum value 17
def_map_size = 400;

// Variables required for calculating map
// No need to change these
var_pi180= '=pi()/180';
var_lat_offset= '0';
var_mc2= '=256*pow(2,$(var_zoom))';
var_mc1= '=256*pow(2,($(var_zoom)-1))';
var_mid_lat= '=min(latitude)+(1+var_lat_offset)*((max(latitude)-min(latitude))/2)';
var_mid_long= '=min(longitude)+(max(longitude)-min(longitude))/2';
var_zoom= '=max(aggr(if(max( round(256*pow(2,(_zoom_level -1)))+( longitude *((256*pow(2,_zoom_level ))/360)) )-min( round(256*pow(2,(_zoom_level -1)))+( longitude *((256*pow(2,_zoom_level ))/360)) ) <map_size_x AND max((256*pow(2,(_zoom_level-1)))+((0.5*log((1+(sin((latitude)*pi()/180)))/(1-(sin((latitude)*pi()/180)))))*((-256*pow(2,_zoom_level))/(2*pi()))))-min((256*pow(2,(_zoom_level-1)))+((0.5*log((1+(sin((latitude)*pi()/180)))/(1-(sin((latitude)*pi()/180)))))*((-256*pow(2,_zoom_level))/(2*pi()))))<map_size_y,_zoom_level,1),_zoom_level))';
var_maptype= '=if(isnull(only(maptype)),fieldvalue( '&chr(39)&'maptype'&chr(39)&', 1 ),maptype)';
map_size_x= '400';
map_size_y= '400';
SET HidePrefix='_' ;
// Field required for calcualting best zoom level
_zoom_level:
Load RecNo( ) as _zoom_level autogenerate(max_zoom_level);
maptype:
LOAD * INLINE [maptype roadmap mobile satellite terrain hybrid ];
[/stextbox]
After pasting the code, click ‘Save’ and then ‘Ok’ to close the Window and reload the script.
[stextbox id = “section”]Create a Scatter Chart and configure for Google map:[/stextbox]
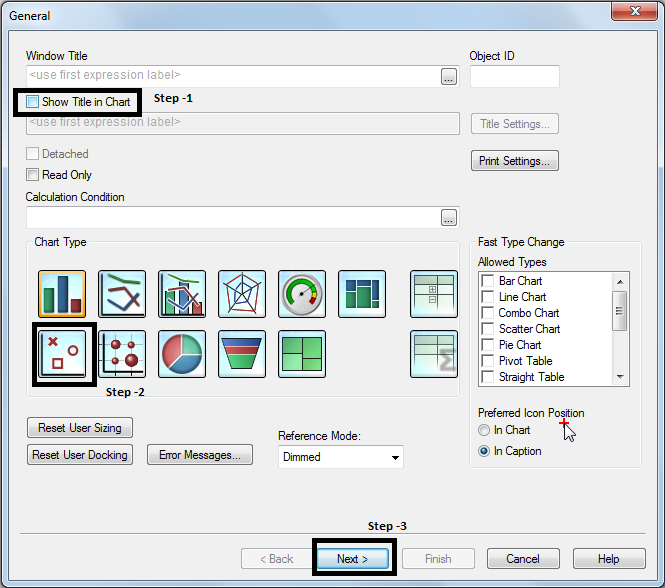
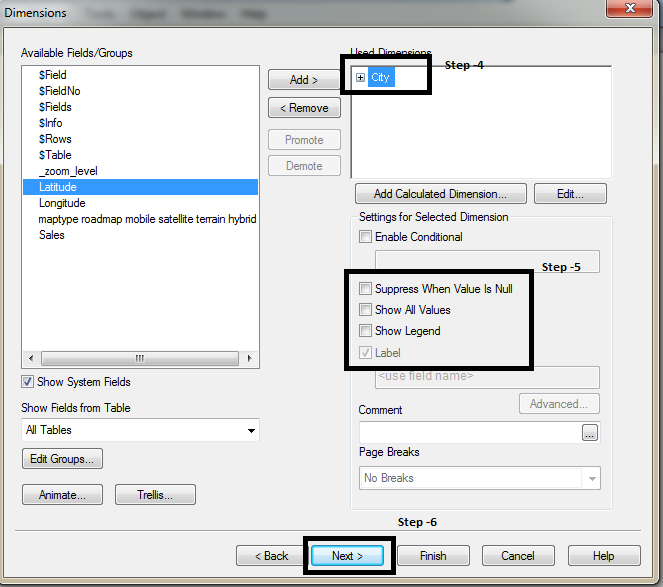
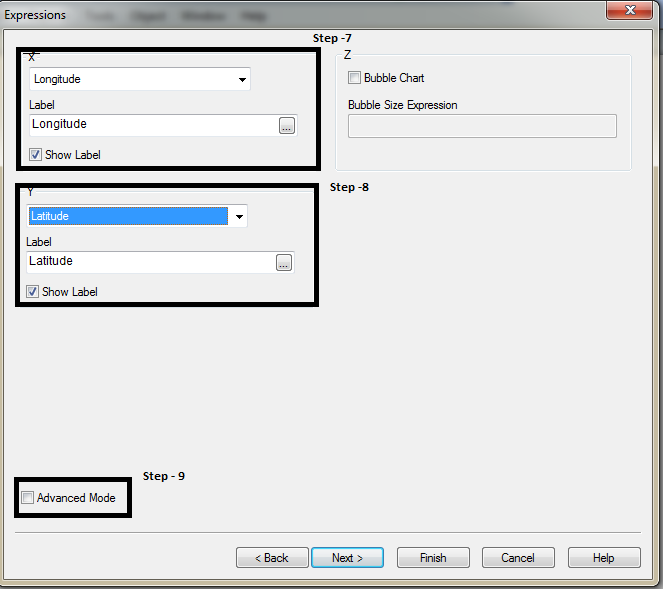
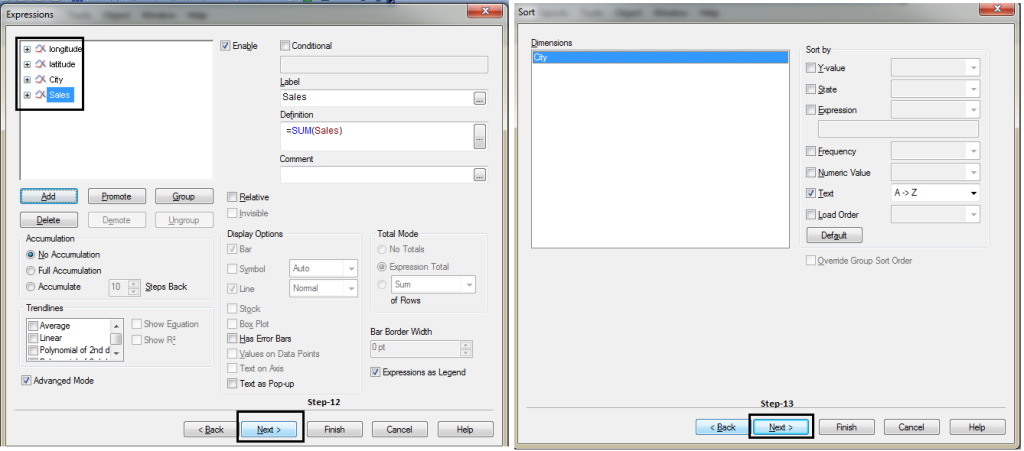
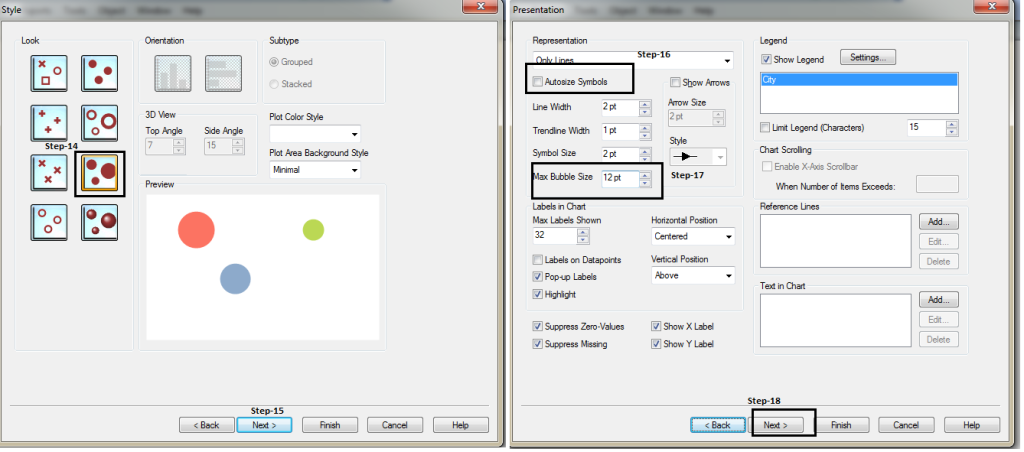
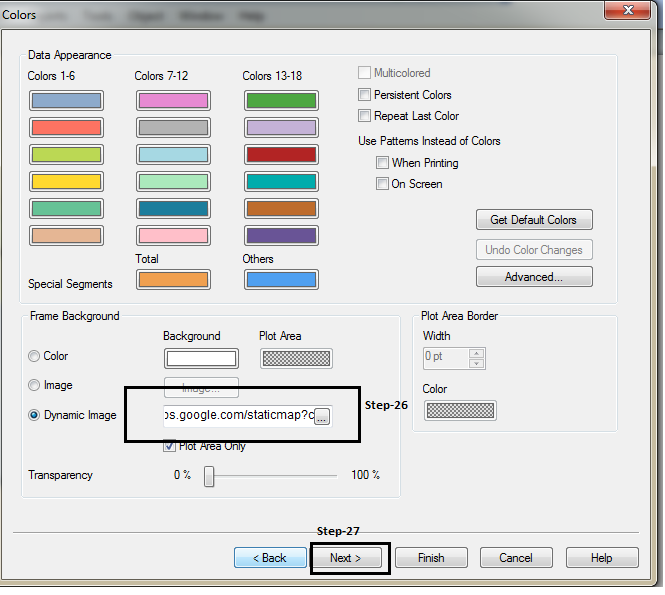
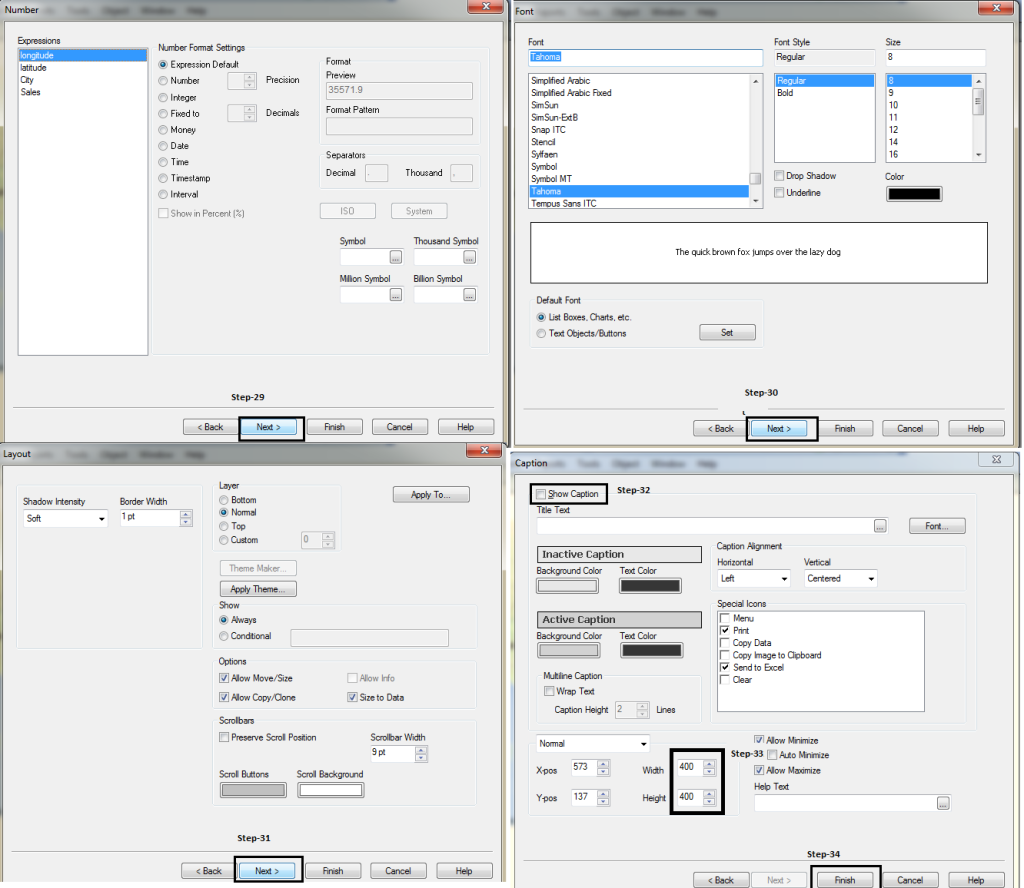
To create chart, “New Sheet Object” –> “Chart” –> Follow the steps shown in below pictures
Step -10: Next, move to SORT tab, press back button and write following code in expression:
[stextbox id = “grey”]
longitude: “=SUM( round (256*pow(2,($(var_zoom)-1)))+( longitude *((256*pow(2,$(var_zoom)))/360)) )”
latitude: “=SUM(((256*pow(2,($(var_zoom)-1)))+((0.5*log((1+(sin((latitude)*pi()/180)))/(1-(sin((latitude)*pi()/180)))))*((-256*pow(2,$(var_zoom)))/(2*pi())))))”
[/stextbox]
Step -11: Add two more expressions: City and Sales
[stextbox id = “grey”]
City:= “City”
Sales: “=sum(Sales)”
[/stextbox]
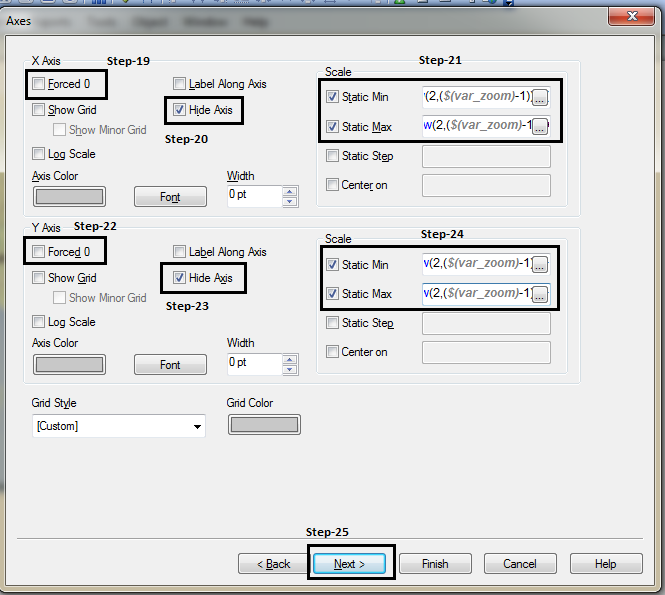
Copy and paste following code in step 21 and 24
[stextbox id = “grey”]
X axis:
static Min: =(256*pow(2,($(var_zoom)-1)))+( var_mid_long *((256*pow(2,$(var_zoom)))/360)) -round(map_size_x/2)
Static Max: =( (256*pow(2,($(var_zoom)-1)))+( var_mid_long *((256*pow(2,$(var_zoom)))/360)) + round(map_size_x/2))
Y axis:
Static Min: =((256*pow(2,($(var_zoom)-1)))+((0.5*log((1+(sin(var_mid_lat*pi()/180)))/(1-(sin(var_mid_lat*pi()/180)))))*((-256*pow(2,$(var_zoom)))/(2*pi())))+round(map_size_y/2))
Static Max: =((256*pow(2,($(var_zoom)-1)))+((0.5*log((1+(sin(var_mid_lat*pi()/180)))/(1-(sin(var_mid_lat*pi()/180)))))*((-256*pow(2,$(var_zoom)))/(2*pi())))-round(map_size_y/2))
[/stextbox]
Copy and Paste following code in Step-26:
[stextbox id = “grey”]
='http://maps.google.com/staticmap?center='
 &
 num(var_mid_lat, '##############', '.', ',' )
 &
 ','
 &
 num(var_mid_long, '##############', '.', ',' )
 &
 '&zoom=$(var_zoom)'
 &
 '&maptype='&var_maptype
 &
 '&size='&map_size_x&'x'&map_size_y
 &
 '&key='&gmap_key & '&.jpg'
[/stextbox]
In Caption tab, width and height according to map_size_x and map_size_y (defined in the script).
Finally, we get the desired results:
This is an example where we represent information on geographical map in Qlikview. Have you done something similar in past? Do you have any experience / case studies illustrating the same in Qlikview or other visualization tools.
Do share your thoughts through comments below.





This is quite an interesting way to represent data! Is there a way to add the legend value as well? Also, believe there is a constraint of plotting only a single variable at a time. Or can we plot multiple?
Nice article. Note, that in some cases "Google Map key" problem could raise. Then better to use this link in Dynamic Image ='http://maps.google.com/maps/api/staticmap?center=' & num(var_mid_lat, '##############', '.', ',' ) & ',' & num(var_mid_long, '##############', '.', ',' ) & '&zoom=$(var_zoom)' & '&maptype='&var_maptype & '&size='&map_size_x&'x'&map_size_y & '&sensor=false'
Yes, you are right Andrei Kaliahin.
Hi Sunil, Nice Article and m able to replicate it..Just curious.Could u please shed some light on the working of code?