Introduction
The best way to learn data science is to work on data problems and solve them. What is even better is to solve these problems with thousands of data scientists around solving the same problem in a competition. And if you get to know what the winners did to solve the problem – you know you are participating in an Analytics Vidhya Hackathon!
We conducted 3 machine learning hackathons as part of AV DataFest 2017. The QuickSolver was conducted on 30 April 2017. More than 1800 data scientists from across the globe competed to grab the top spots.
If you missed this hackathon, you did miss an amazing opportunity. Well, you can still learn from the winners & their strategies. To hear the experiences and strategies of the data scientists who won, join us for the DataFest Closing Ceremony on 10 May 2017.
![]()
Problem Statement
The problem statement revolved around a digital publication house. They publish articles on varied categories & topics like general knowledge, practical well being, sports & health. These articles are written by distinguished authors in this field. To keep the reader engaged on the website, the portal recommends articles to its readers randomly.
They want to enhance their customer experience, and understand the interest of their customers in detail. Instead of recommending articles to its reader randomly they would like to recommend articles based on their interest & are more likely to read. Currently, the portal has an option to rate articles based after reading.
The data scientists had to predict how much would the reader like the article based on the given data.
Winners
The winners used different approaches and rose up on the leaderboard. Below are the top 3 winners on the leaderboard:
Rank 1: Mark Landry
Rank 2: Rohan Rao
Rank 3: Piyush Jaiswal
Here are the final rankings of all the participants at the leaderboard.
All the Top 3 winners have shared their detailed approach & code from the competition. I am sure you are eager to know their secrets, go ahead
Piyush Jaiswal, Rank 3

Piyush Jaiswal
Piyush is a Data Science Analyst at 64 Squares based in Pune. He is a machine learning enthusiast and has participated in several competitions on Analytics Vidhya.
Here’s what Piyush shared with us.
Piyush says ” The model was built around 4 sets of features primarily.
1. Meta data on User : Age buckets and variable V1
2. Meta data on Article : Time since article was published, Number of articles by the same author & Number of articles in the same category
- User Preferences
- How does he/she rate in general : Since it involves the target variable, it was calculated using a 5 fold approach for train data and then using the entire train data for the test data
- Mean, Median, Min, Max rating of the user
- % ratings in low (0 to 1), medium (2 to 4) and high (5 to 6) buckets
- Article Characteristics when he/she rates low/medium/high
- Mean, Min & Max of ‘Vintage Months’ when the user rates low/medium/high
- Mean, Min & Max of ‘Number of Articles by same author’ when the user rates low/medium/high
- Was planning to expand on this but could not because of limited time
3. Article Preferences
- How is the article rated in general: Since it involves the target variable, it was calculated using a 5 fold approach for train data and then using the entire train data for the test data
- Mean, Median, Min, Max rating of the article
- I was thinking of creating % ratings in low , medium and high buckets but could not do so because of time constraint
- User characteristics when the article is rated low/medium/high
- Again, could not implement this due to time constraint
4. Choice of model was Xgboost. Tried an ensemble between 2 xgb models but it gave little boost (from 1.7899 to 1.7895)
Solution: Link to Code
Rohan Rao, Rank 2

Rohan Rao
Rohan is a Senior Data Scientist at Paytm & a Kaggle Grandmaster. Rohan holds multiple accolades on his name. He has won several competitions on Analytics Vidhya and has been actively participating in machine learning competitions. His approach always has interesting insights.
Here’s what Rohan shared with us.
2. Used raw features + count features initially with XGBoost.
3. On plotting feature importance, I found the user-id to be the most important variable. So, split the train data into two halves, and used the average rating of users from one half of the data as a feature in the second half, and built my model on only the second half of the training data. This gave a major boost and the score reached 1.80
4. I ensembled few XGBoosts with different seeds and to finally get below 1.79
5. Some final tweaks like directly populating the common IDs between train & test and clipping the predictions between 0 and 6, gave minor improvements as well.
Tuning parameters and using linear models didn’t really work. I even tried building a multi-class classification model, but that performed much worse than regression, which is natural considering the metric is RMSE.
Solution: Link to Code
Mark Landry, Rank 1

Mark Landry
Mark is a Competitive Data Scientist & Product manager at H2O.ai. Mark is also an active participant in machine learning competition on Analytics Vidhya & Kaggle. Mark has won several hackathons and ranked highly for his machine learning skills. He has several other accomplishments on his name.
Here’s what Mark shared with us.
Mark says,
In short, features were created using data.table in R and the modeling was done with three H2O models: random forest and two GBMs.
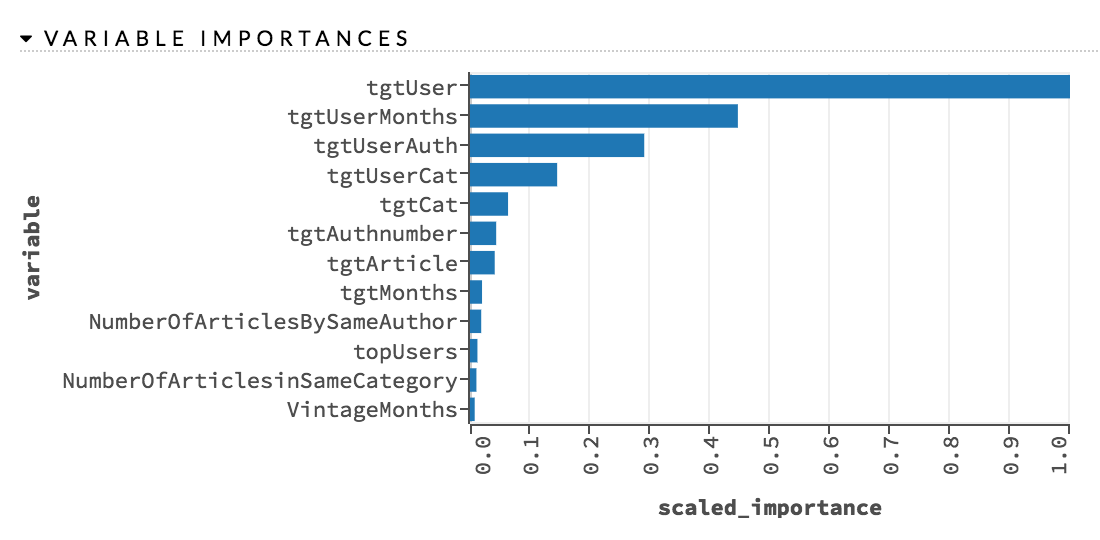
The progression of the models is actually represented in the way the features are laid out. The initial submission scored 1.94 on the public leaderboard (which scored very close to private) and was quickly tuned to about 1.82. This spanned the first six target encodings, no IDs, only the three Article features directly. Over time, I kept adding more (including a pair that surprisingly reduced model quality) all the way to the end. Light experimentation on the modeling hyperparameters, which are likely underfit. Random forest wound up my strongest model, most likely due to lack of internal CV of the GBMs that led to me staying fairly careful.
I kept the User and Article IDs out of the modeling from the start. At one point I used the most frequent User_ID values, but this did not help – the models were already picking up enough of the user qualities. The main feature style is target encoding, so in the code you will see sets of three lines that calculate the sum of response, count of records, and then performs an average that removes the impact of the record to which it is applying the “average”. You’ll see the same style in my Xtreme ML Hack solution (I started from that code, in fact) and also Knocktober 2016.
The short duration and unlimited submissions for this competition kept me moving quickly, but at a disadvantage for model tuning. No doubt these parameters are not ideal, but that was just a choice I made to keep the leaderboard as my improvement focus and iterations extremely short, rather than internal validation. Had either the train/test split or public/private split not appeared random, I would have modeled things differently. But this was a fairly simple situation for getting away with such tactics.
A 550-tree default Random Forest was my best individual model.
Here is the feature utilization.
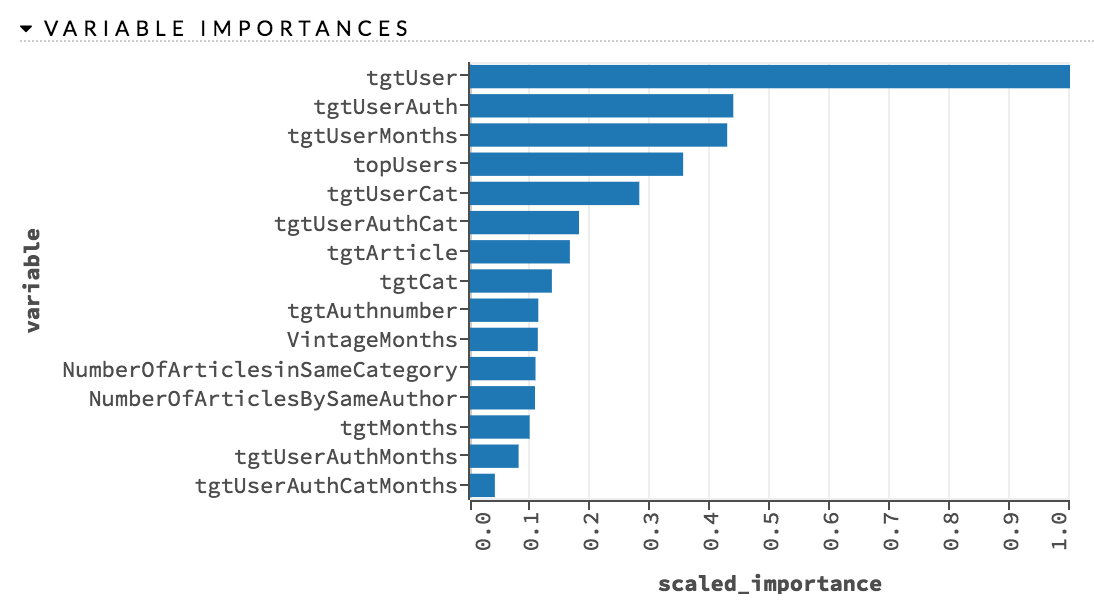
I used a pair of GBMs with slightly different parameters. These features are for the model with 200 trees, a 0.025 learning rate, depth of 5, row sampling of 60% and column sampling of 60%. 
Thanks to Analytics Vidhya for hosting this competition and all of AV DataFest 2017, as well as all participants who worked on the problem and pushed the leaderboard. This was my first six-hour competition and it was as fun as the half-week competitions.
Solution: Link to Code
End Notes
It was great fun interacting with these winners and to know their approach during the competition. Hopefully, you will be able to evaluate where you missed out.


Thanks to all guys, Just because all solutions are in R, I was wondering if some of python programmers would like to publish their solutions also if not perfect or in top ten..
Thanks Gianni for the comment! The objective of this article is sharing winners approach irrespective of tool they are using. You can post this tool specific requirement to our slack channel, here any community member will share their python code (https://analyticsvidhya.slack.com/messages/C0SEHHCUB/details/) specific to this challenge. Regards, Sunil
Thank you for the article. Where can one get data and the description of the problem. Without that one cannot get much value out of this article. Thank you for your help.