What’s the first image that comes to your mind when you think about Random Forest? It conjures up images of trees and a mystical and magical land. And that’s what the Random Forest algorithm does!
It is an ensemble algorithm that combines multiple decision trees and navigates complex problems to give us the final result.

I’ve lost count of the number of times I’ve relied on the Random Forest algorithm in my machine learning projects and even hackathons. What makes random forest different from other ensemble algorithms is the fact that each individual tree is built on a subset of data and features.
Random Forest comes with a caveat – the numerous hyperparameters that can make fresher data scientists weak in the knees. But don’t worry! In this article, we will be looking at the various Random Forest hyperparameters and understand how to tune and optimize them.
I assume you have a basic understanding of the random forest algorithm (and decision trees). If not, I encourage you to go through the below resources first:
Table of contents
- Random Forest Hyperparameters we’ll be Looking at:
- Random Forest Hyperparameter #1: max_depth
- Random Forest Hyperparameter #2: min_sample_split
- Random Forest Hyperparameter #3: max_terminal_nodes
- Random Forest Hyperparameter #4: min_samples_leaf
- Random Forest Hyperparameter #5: n_estimators
- Random Forest Hyperparameter #6: max_samples
- Random Forest Hyperparameter #7: max_features
- Conclusion
Random Forest Hyperparameters we’ll be Looking at:
- max_depth
- min_sample_split
- max_leaf_nodes
- min_samples_leaf
- n_estimators
- max_sample (bootstrap sample)
- max_features
Random Forest Hyperparameter #1: max_depth
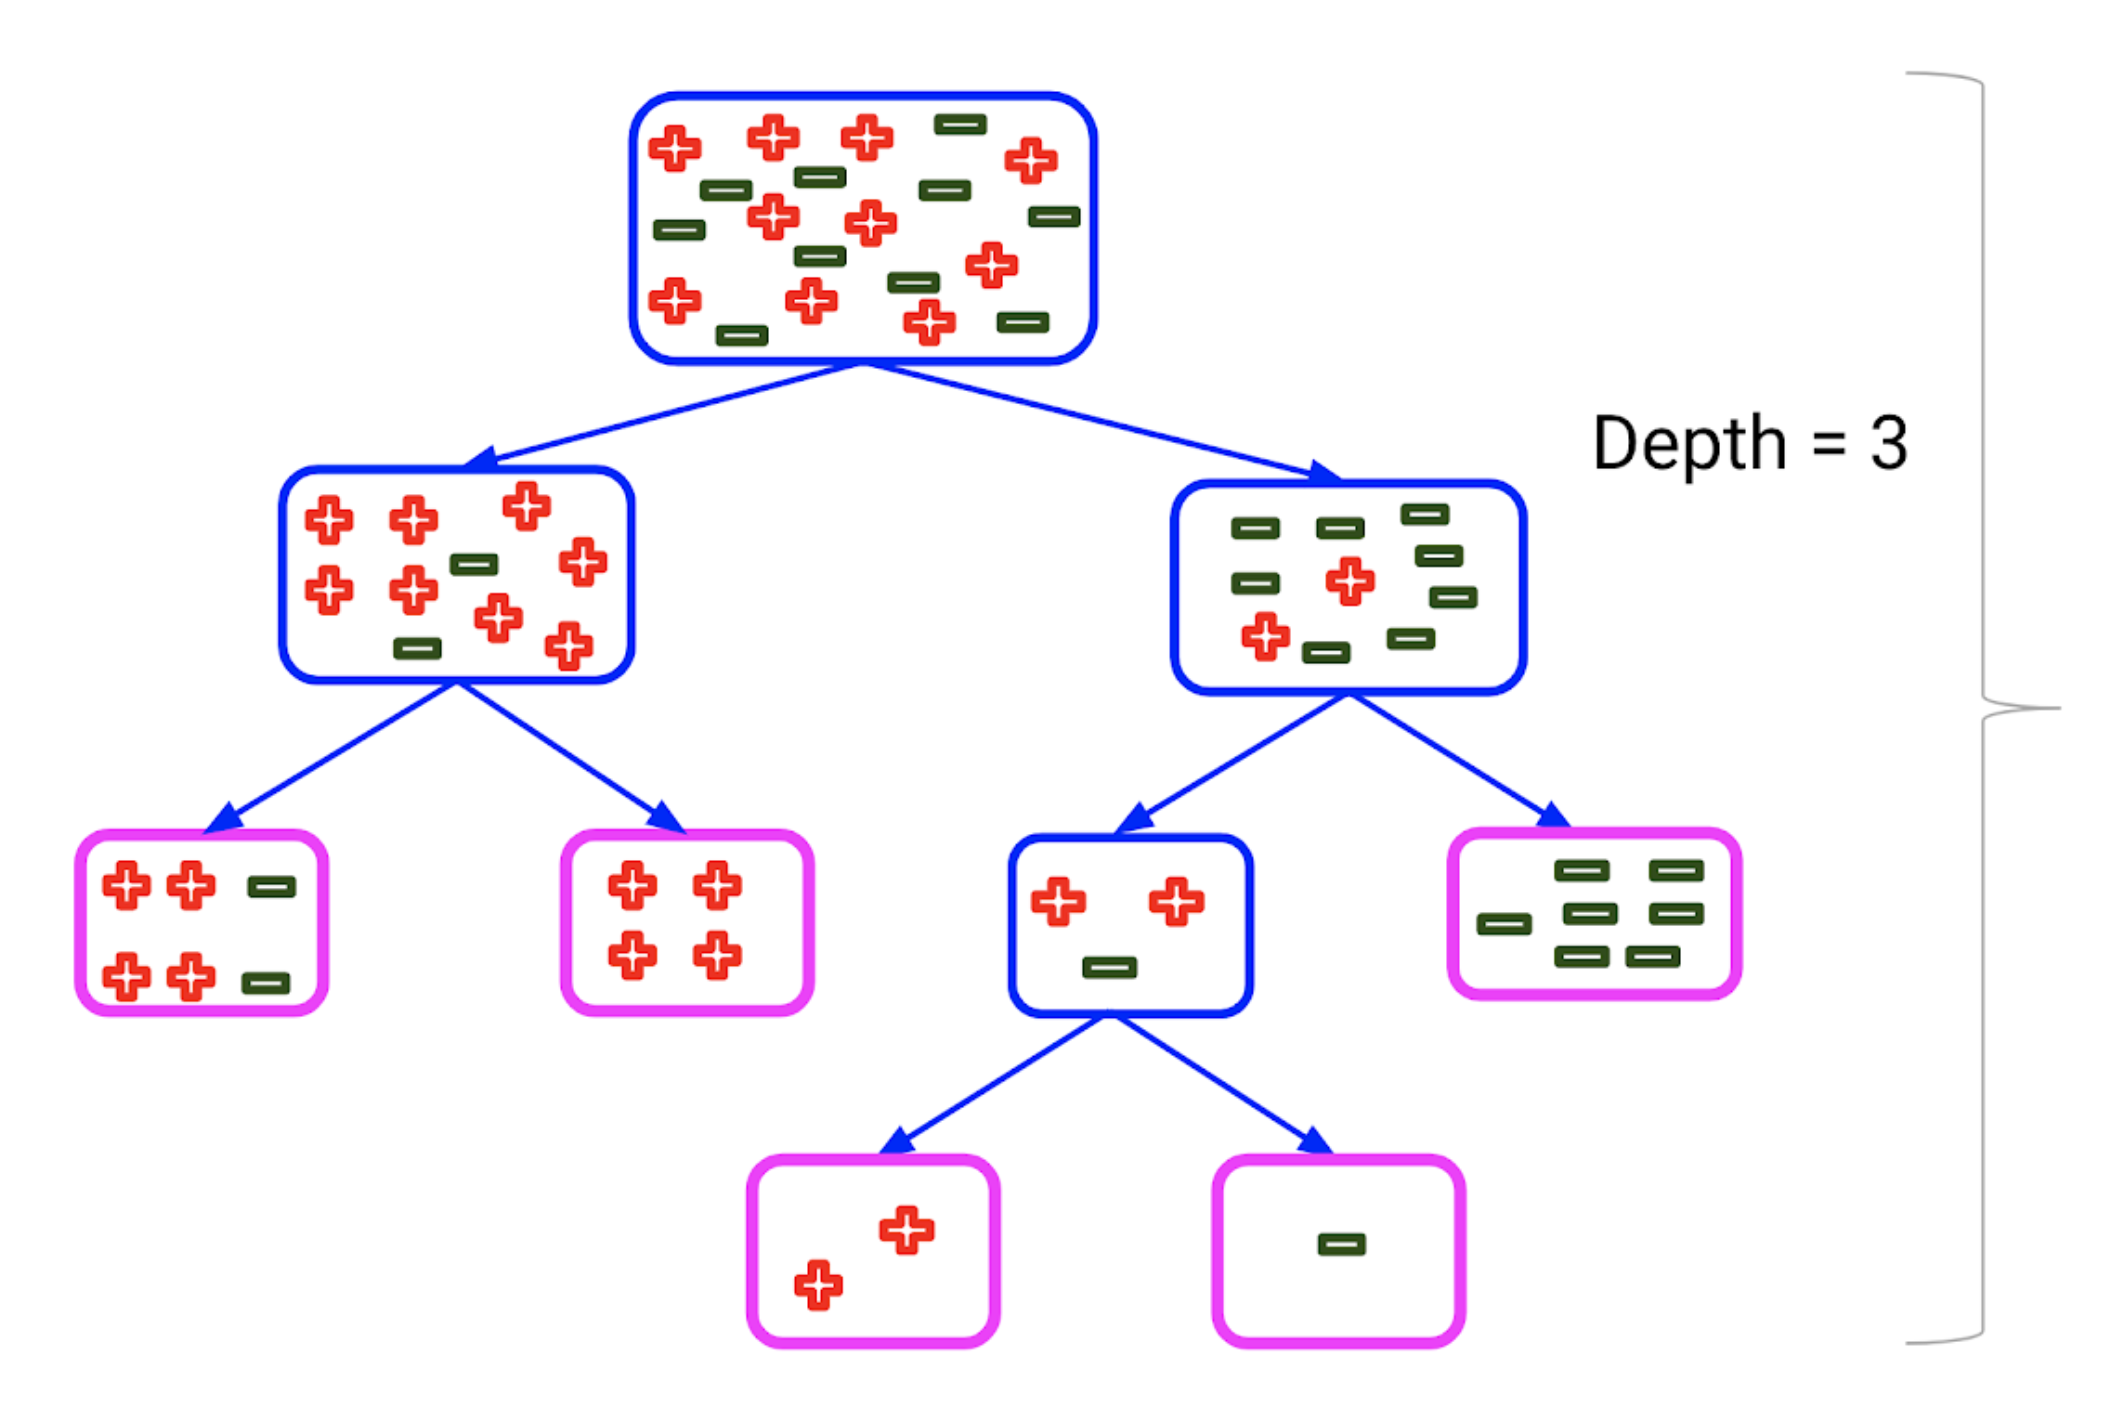
Let’s discuss the critical max_depth hyperparameter first. The max_depth of a tree in Random Forest is defined as the longest path between the root node and the leaf node:
Using the max_depth parameter, I can limit up to what depth I want every tree in my random forest to grow.
In this graph, we can clearly see that as the max depth of the decision tree increases, the performance of the model over the training set increases continuously. On the other hand as the max_depth value increases, the performance over the test set increases initially but after a certain point, it starts to decrease rapidly.
Can you think of a reason for this? The tree starts to overfit the training set and therefore is not able to generalize over the unseen points in the test set.
Among the parameters of a decision tree, max_depth works on the macro level by greatly reducing the growth of the Decision Tree.
Random Forest Hyperparameter #2: min_sample_split
min_sample_split – a parameter that tells the decision tree in a random forest the minimum required number of observations in any given node in order to split it.
The default value of the minimum_sample_split is assigned to 2. This means that if any terminal node has more than two observations and is not a pure node, we can split it further into subnodes.
Having a default value as 2 poses the issue that a tree often keeps on splitting until the nodes are completely pure. As a result, the tree grows in size and therefore overfits the data.
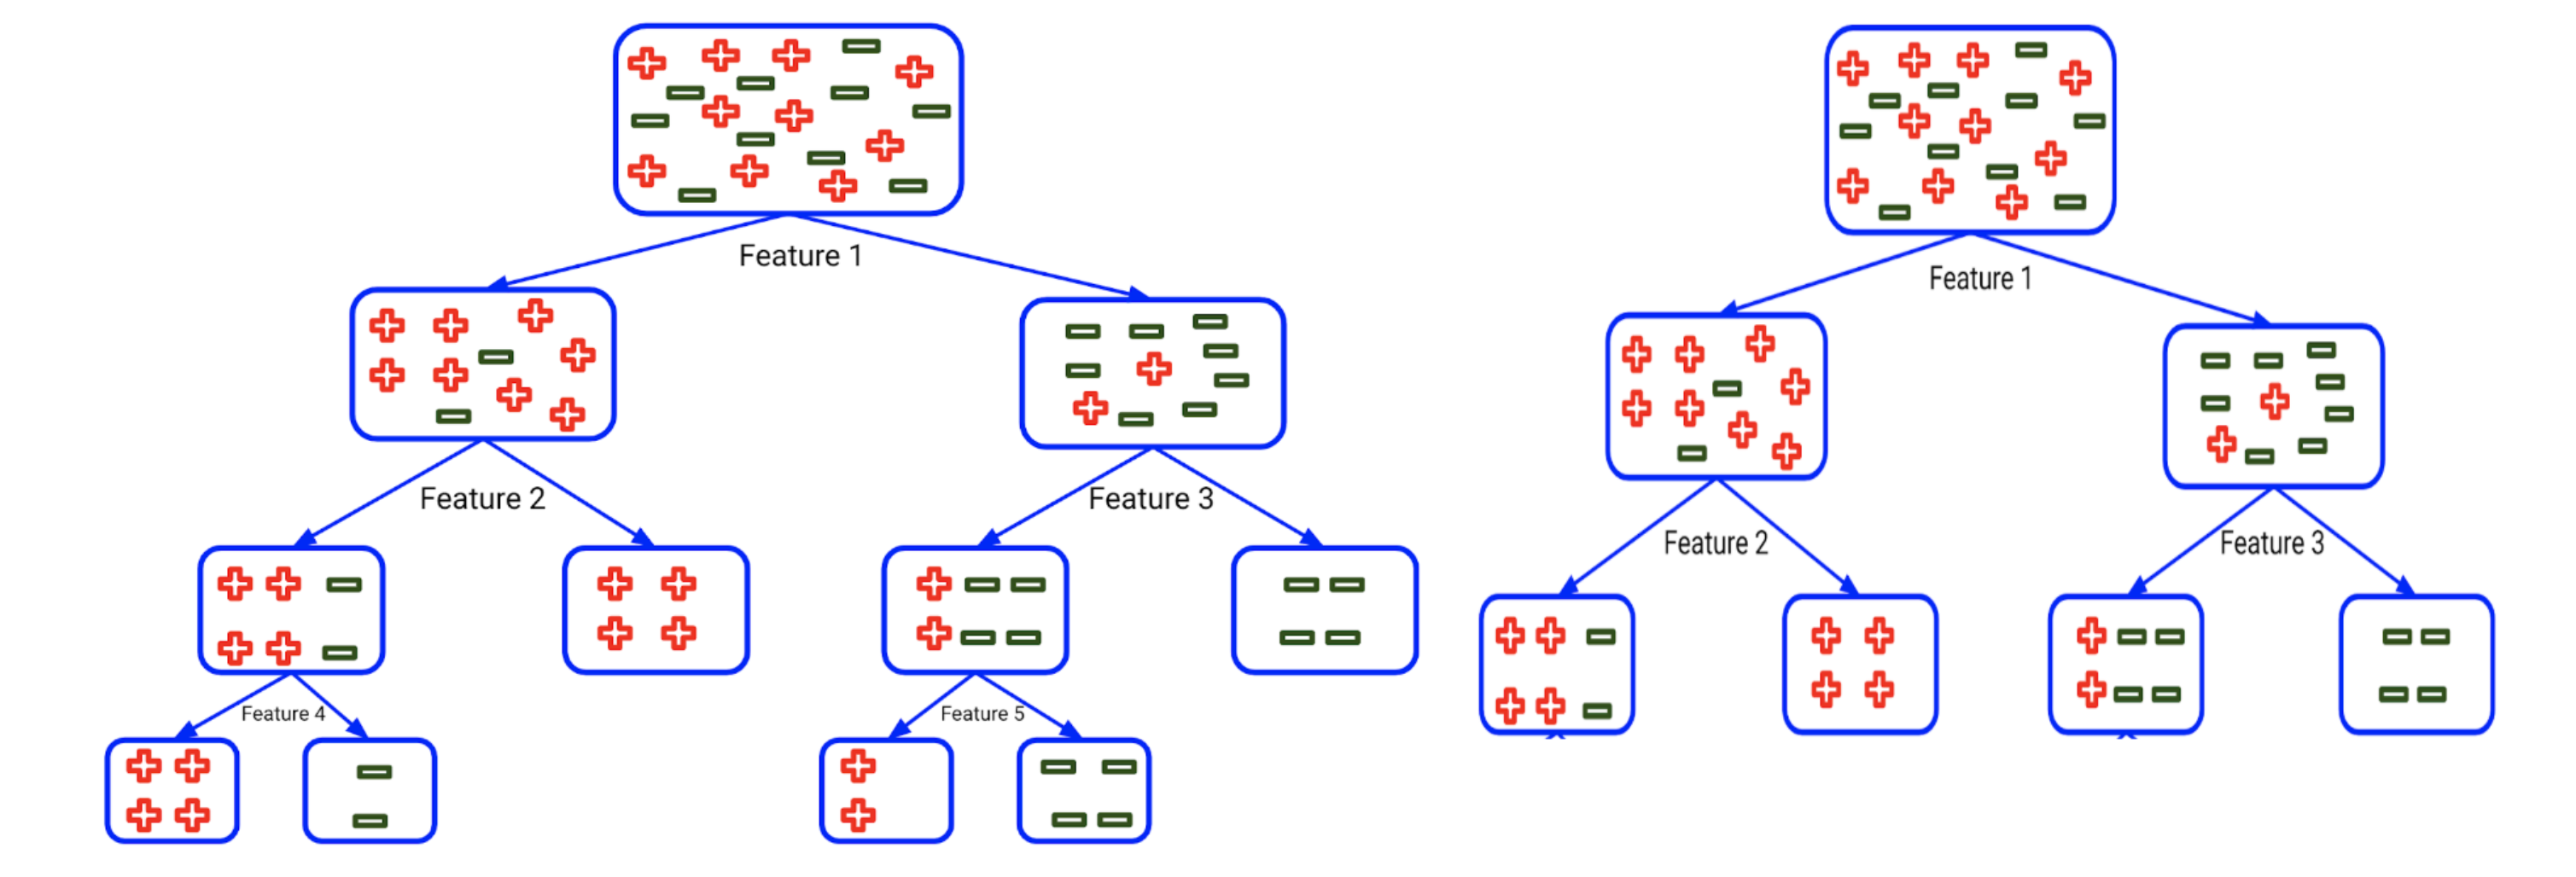
By increasing the value of the min_sample_split, we can reduce the number of splits that happen in the decision tree and therefore prevent the model from overfitting. In the above example, if we increase the min_sample_split value from 2 to 6, the tree on the left would then look like the tree on the right.
Now, let’s look at the effect of min_samples_split on the performance of the model. The graph below is plotted considering that all the other parameters remain the same and only the value of min_samples_split is changed:
On increasing the value of the min_sample_split hyperparameter, we can clearly see that for the small value of parameters, there is a significant difference between the training score and the test scores. But as the value of the parameter increases, the difference between the train score and the test score decreases.
But there’s one thing you should keep in mind. When the parameter value increases too much, there is an overall dip in both the training score and test scores. This is due to the fact that the minimum requirement of splitting a node is so high that there are no significant splits observed. As a result, the random forest starts to underfit.
You can read more about the concept of overfitting and underfitting here:
Random Forest Hyperparameter #3: max_terminal_nodes
Next, let’s move on to another Random Forest hyperparameter called max_leaf_nodes. This hyperparameter sets a condition on the splitting of the nodes in the tree and hence restricts the growth of the tree. If after splitting we have more terminal nodes than the specified number of terminal nodes, it will stop the splitting and the tree will not grow further.
Let’s say we set the maximum terminal nodes as 2 in this case. As there is only one node, it will allow the tree to grow further:
Now, after the first split, you can see that there are 2 nodes here and we have set the maximum terminal nodes as 2. Hence, the tree will terminate here and will not grow further. This is how setting the maximum terminal nodes or max_leaf_nodes can help us in preventing overfitting.
Note that if the value of the max_leaf_nodes is very small, the random forest is likely to underfit. Let’s see how this parameter affects the random forest model’s performance:
We can see that when the parameter value is very small, the tree is underfitting and as the parameter value increases, the performance of the tree over both test and train increases. According to this plot, the tree starts to overfit as the parameter value goes beyond 25.
Random Forest Hyperparameter #4: min_samples_leaf
Time to shift our focus to min_sample_leaf. This Random Forest hyperparameter specifies the minimum number of samples that should be present in the leaf node after splitting a node.
Let’s understand min_sample_leaf using an example. Let’s say we have set the minimum samples for a terminal node as 5:
The tree on the left represents an unconstrained tree. Here, the nodes marked with green color satisfy the condition as they have a minimum of 5 samples. Hence, they will be treated as the leaf or terminal nodes.
However, the red node has only 3 samples and hence it will not be considered as the leaf node. Its parent node will become the leaf node. That’s why the tree on the right represents the results when we set the minimum samples for the terminal node as 5.
So, we have controlled the growth of the tree by setting a minimum sample criterion for terminal nodes. As you would have guessed, similar to the two hyperparameters mentioned above, this hyperparameter also helps prevent overfitting as the parameter value increases.
If we plot the performance/parameter value plot as before:
We can clearly see that the Random Forest model is overfitting when the parameter value is very low (when parameter value < 100), but the model performance quickly rises up and rectifies the issue of overfitting (100 < parameter value < 400). But when we keep on increasing the value of the parameter (> 500), the model slowly drifts towards the realm of underfitting.
So far, we have looked at the hyperparameters that are also covered in Decision Trees. Let’s now look at the hyperparameters that are exclusive to Random Forest. Since Random Forest is a collection of decision trees, let’s begin with the number of estimators.
Random Forest Hyperparameter #5: n_estimators
We know that a Random Forest algorithm is nothing but a grouping of trees. But how many trees should we consider? That’s a common question fresher data scientists ask. And it’s a valid one!
We might say that more trees should be able to produce a more generalized result, right? But by choosing more number of trees, the time complexity of the Random Forest model also increases.
In this graph, we can clearly see that the performance of the model sharply increases and then stagnates at a certain level:
This means that choosing a large number of estimators in a random forest model is not the best idea. Although it will not degrade the model, it can save you the computational complexity and prevent the use of a fire extinguisher on your CPU!
Random Forest Hyperparameter #6: max_samples
The max_samples hyperparameter determines what fraction of the original dataset is given to any individual tree. You might be thinking that more data is always better. Let’s try to see if that makes sense.
We can see that the performance of the model rises sharply and then saturates fairly quickly. Can you figure out what the key takeaway from this visualization is?
It is not necessary to give each decision tree of the Random Forest the full data. If you would notice, the model performance reaches its max when the data provided is less than 0.2 fraction of the original dataset. That’s quite astonishing!
Although this fraction will differ from dataset to dataset, we can allocate a lesser fraction of bootstrapped data to each decision tree. As a result, the training time of the Random Forest model is reduced drastically.
Random Forest Hyperparameter #7: max_features
Finally, we will observe the effect of the max_features hyperparameter. This resembles the number of maximum features provided to each tree in a random forest.
We know that random forest chooses some random samples from the features to find the best split. Let’s see how varying this parameter can affect our random forest model’s performance.
We can see that the performance of the model initially increases as the number of max_feature increases. But, after a certain point, the train_score keeps on increasing. But the test_score saturates and even starts decreasing towards the end, which clearly means that the model starts to overfit.
Ideally, the overall performance of the model is the highest close to 6 value of the max features. It is a good convention to consider the default value of this parameter, which is set to square root of the number of features present in the dataset. The ideal number of max_features generally tend to lie close to this value.
Conclusion
With this, we conclude our discussion on how to tune the various hyperparameters of a Random Forest model. I covered the 7 key hyperparameters here and you can explore these plus the other ones on your own. That’s the best way to learn a concept and ingrain it.
Next, you should check out the comprehensive and popular Applied Machine Learning course as the logical step in your machine learning journey!
Frequently Asked Questions
A. Hyperparameters of a Random Forest include:
1. Number of Trees: The quantity of decision trees in the forest.
2. Tree Depth: Maximum depth of each decision tree.
3. Number of Features: The count of features considered at each split.
4. Criterion: Measure to evaluate quality of splits (e.g., Gini impurity, entropy).
5. Minimum Samples per Leaf: Minimum samples required in a leaf node.
6. Minimum Samples per Split: Minimum samples required to split a node.
7. Bootstrap Sampling: Whether to use bootstrap sampling while building trees.
A. Hyperparameter tuning in decision trees and random forests involves adjusting the settings that aren’t learned from data but influence model performance. It aims to find the optimal values for parameters like tree depth, number of trees, and feature selection methods. By iteratively testing different combinations through techniques like grid search or random search, the goal is to enhance model accuracy and generalization on unseen data.


Very very good information .. Thank you so much
Very good information. Can I have the source code of visualizing the figures of the parameters?