This article was published as a part of the Data Science Blogathon.
Introduction
Success is a process not an event.
Data Science is growing rapidly in all sectors. With the availability of so many technologies within the Data Science domain, it becomes tricky to crack any Data Science interview. In this article, we have tried to cover the most common Data Science interview questions asked by recruiters.
The most important concepts and interview questions are as follows :
1. What is Linear Regression. What are the Assumptions involved in it?
Answer : The question can also be phrased as to why linear regression is not a very effective algorithm.
Linear Regression is a mathematical relationship between an independent and dependent variable. The relationship is a direct proportion, relation making it the most simple relationship between the variables.
Y = mX+c
Y – Dependent Variable
X – Independent Variable
m and c are constants
Assumptions of Linear Regression :
- The relationship between Y and X must be Linear.
- The features must be independent of each other.
- Homoscedasticity – The variation between the output must be constant for different input data.
- The distribution of Y along X should be the Normal Distribution.
2. What is Logistic Regression? What is the loss function in LR?
Answer : Logistic Regression is the Binary Classification. It is a statistical model that uses the logit function on the top of the probability to give 0 or 1 as a result.
The loss function in LR is known as the Log Loss function. The equation for which is given as :
3. Difference between Regression and Classification?
Answer : The major difference between Regression and Classification is that Regression results in a continuous quantitative value while Classification is predicting the discrete labels.
However, there is no clear line that draws the difference between the two. We have a few properties of both Regression and Classification. These are as follows:
Regression
- Regression predicts the quantity.
- We can have discrete as well as continuous values as input for regression.
- If input data are ordered with respect to the time it becomes time series forecasting.
Classification
- The Classification problem for two classes is known as Binary Classification.
- Classification can be split into Multi- Class Classification or Multi-Label Classification.
- We focus more on accuracy in Classification while we focus more on the error term in Regression.
4. What is Natural Language Processing? State some real life example of NLP.
Answer : Natural Language Processing is a branch of Artificial Intelligence that deals with the conversation of Human Language to Machine Understandable language so that it can be processed by ML models.
Examples – NLP has so many practical applications including chatbots, google translate, and many other real time applications like Alexa.
Some of the other applications of NLP are in text completion, text suggestions, and sentence correction.
5. Why do we need Evaluation Metrics. What do you understand by Confusion Matrix ?
Answer : Evaluation Metrics are statistical measures of model performance. They are very important because to determine the performance of any model it is very significant to use various Evaluation Metrics. Few of the evaluation Metrics are – Accuracy, Log Loss, Confusion Matrix.
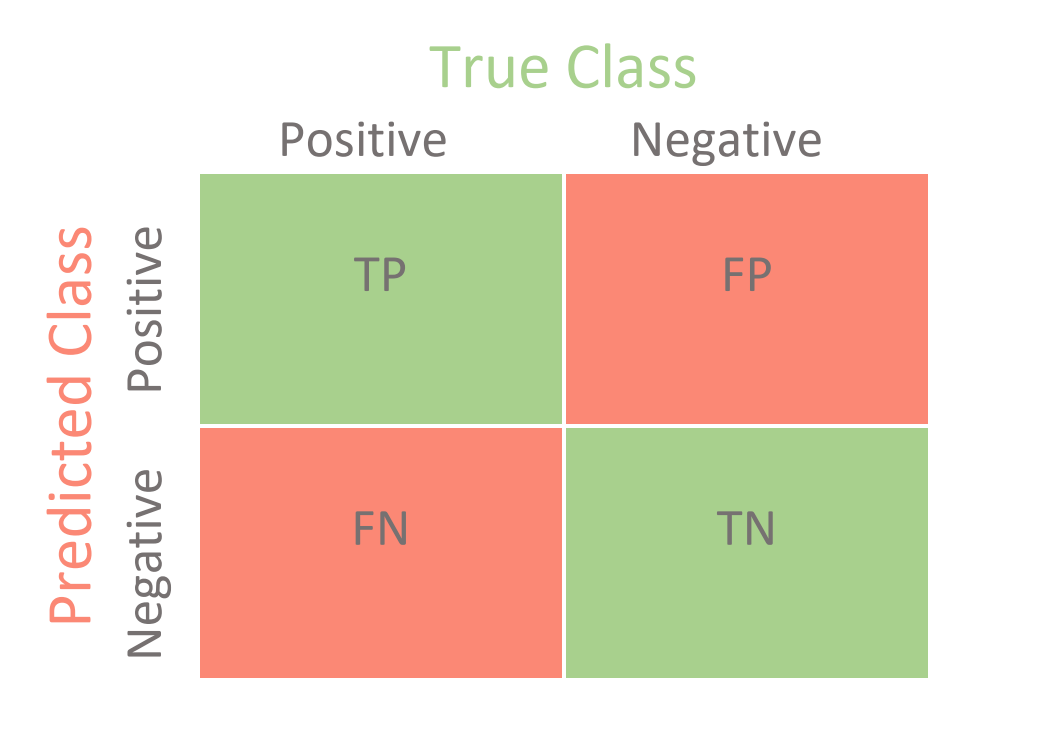
Confusion Matrix is a matrix to find the performance of a Classification model. It is in general a 2×2 matrix with one side as prediction and the other side as actual values.
6. How does Confusion Matrix help in evaluating model performance?
Answer: We can find different accuracy measures using a confusion matrix. These parameters are Accuracy, Recall, Precision, F1 Score, and Specificity.
7. What is the significance of Sampling? Name some techniques for Sampling?
Answer : For analyzing the data we cannot proceed with the whole volume at once for large datasets. We need to take some samples from the data which can represent the whole population. While making a sample out of complete data, we should take that data which can be a true representative of the whole data set.
There are mainly two types of Sampling techniques based on Statistics.
Probability Sampling and Non Probability Sampling
Probability Sampling – Simple Random, Clustered Sampling, Stratified Sampling.
Non Probability Sampling – Convenience Sampling, Quota Sampling, Snowball Sampling.
8. What are Type 1 and Type 2 errors? In which scenarios the Type 1 and Type 2 errors become significant?
Answer : Rejection of True Null Hypothesis is known as a Type 1 error. In simple terms, False Positive are known as a Type 1 Error.
Not rejecting the False Null Hypothesis is known as a Type 2 error. False Negatives are known as a Type 2 error.
Type 1 Error is significant where the importance of being negative becomes significant. For example – If a man is not suffering from a particular disease marked as positive for that infection. The medications given to him might damage his organs.
While Type 2 Error is significant in cases where the importance of being positive becomes important. For example – The alarm has to be raised in case of burglary in a bank. But a system identifies it as a False case that won’t raise the alarm on time resulting in a heavy loss.
9. What are the conditions for Overfitting and Underfitting?
Answer :
In Overfitting the model performs well for the training data, but for any new data it fails to provide output. For Underfitting the model is very simple and not able to identify the correct relationship. Following are the bias and variance conditions.
Overfitting – Low bias and High Variance results in overfitted model. Decision tree is more prone to Overfitting.
Underfitting – High bias and Low Variance. Such model doesn’t perform well on test data also. For example – Linear Regression is more prone to Underfitting.
10. What do you mean by Normalisation? Difference between Normalisation and Standardization?
Answer : Normalisation is a process of bringing the features in a simple range, so that model can perform well and do not get inclined towards any particular feature.
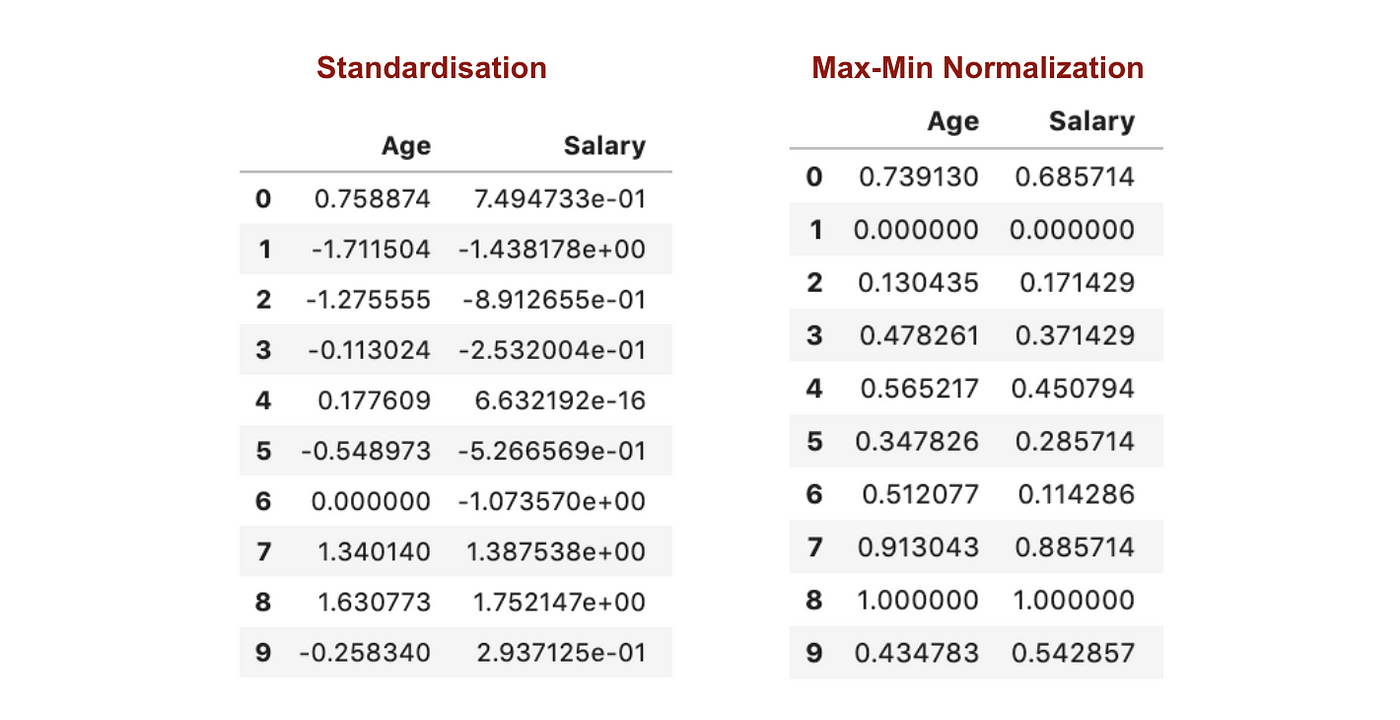
For example – If we have a dataset with multiple features and one feature is the Age data which is in the range 18-60 , Another feature is the salary feature ranging from 20000 – 2000000. In such a case, the values have a very much difference in them. Age ranges in two digits integer while salary is in range significantly higher than the age. So to bring the features in comparable range we need Normalisation.
Both Normalisation and Standardization are methods of Features Conversion. However, the methods are different in terms of the conversions. The data after Normalisation scales in the range of 0-1. While in case of Standardization the data is scaled such that it means comes out to be 0.
11. What do you mean by Regularisation? What are L1 and L2 Regularisation?
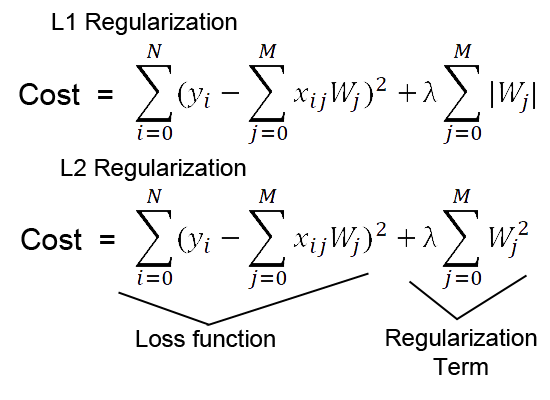
Answer : Regulation is a method to improve your model which is Overfitted by introducing extra terms in the loss function. This helps in making the model performance better for unseen data.
There are two types of Regularisation :
L1 Regularisation – In L1 we add lambda times the absolute weight terms to the loss function. In this the feature weights are penalised on the basis of absolute value.
L2 Regularisation – In L2 we add lambda times the squared weight terms to the loss function. In this the feature weights are penalised on the basis of squared values.
12. Describe Decision tree Algorithm and what are entropy and information gain?
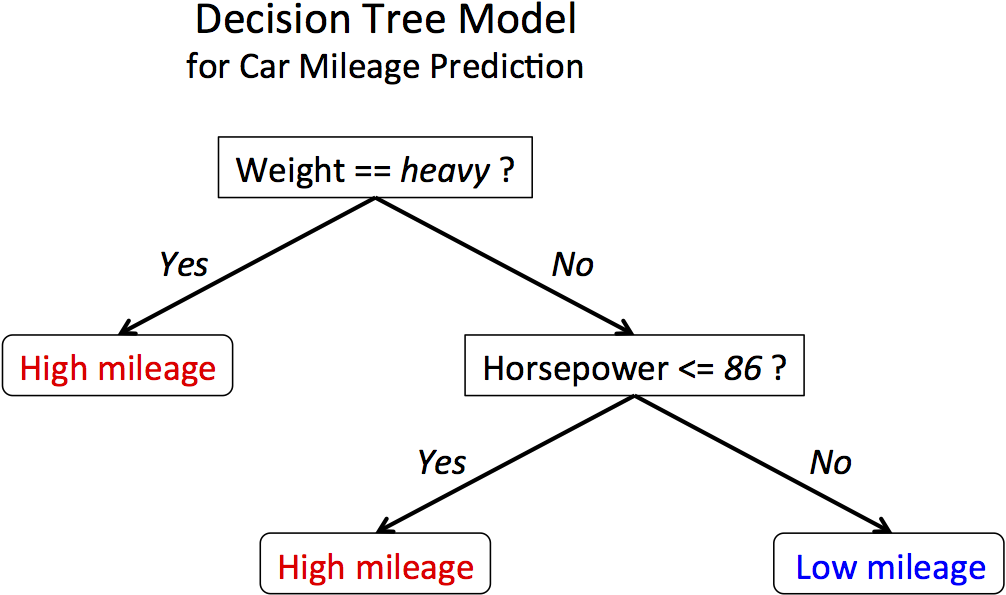
Answer : Decision tree is a Supervised Machine Learning approach. It uses the predetermined decisions data to prepare a model based on previous output. It follows a system to identify the pattern and predict the classes or output variable from previous output .
The Decision tree works in the following manner –
It takes the complete set of Data and try to identify a point with highest information gain and least entropy to mark it as a data node and proceed further in this manner. Entropy and Information gain are deciding factor to identify the data node in a Decision Tree.
13. What is Ensemble Learning. Give an important example of Ensemble Learning?
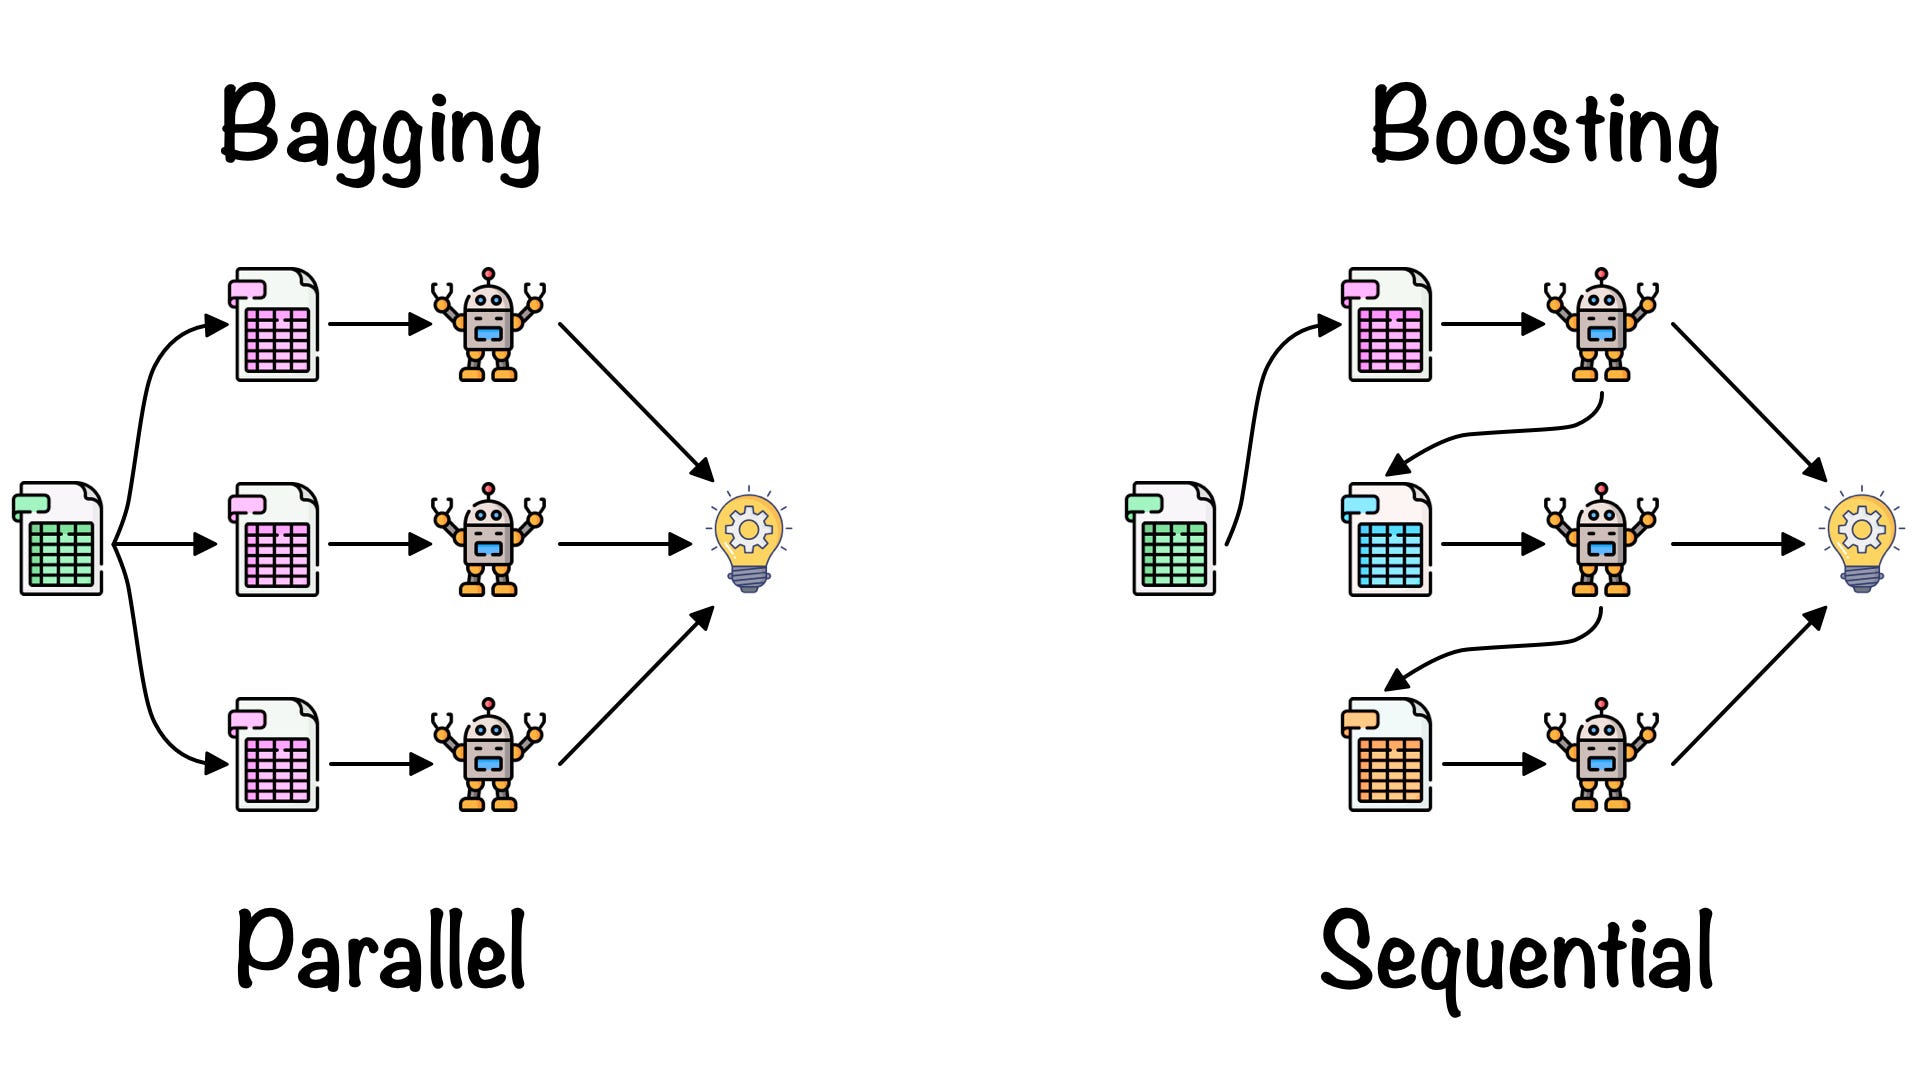
Answer : Ensemble Learning is a process of accumulating multiple models to form a better prediction model. In Ensemble Learning the performance of the individual model contributes to the overall development in every step. There are two common techniques in this – Bagging and Boosting.
Bagging – In this the data set is split to perform parallel processing of models and results are accumulated based on performance to achieve better accuracy.
Boosting – This is a sequential technique in which a result from one model is passed to another model to reduce error at every step making it a better performance model.
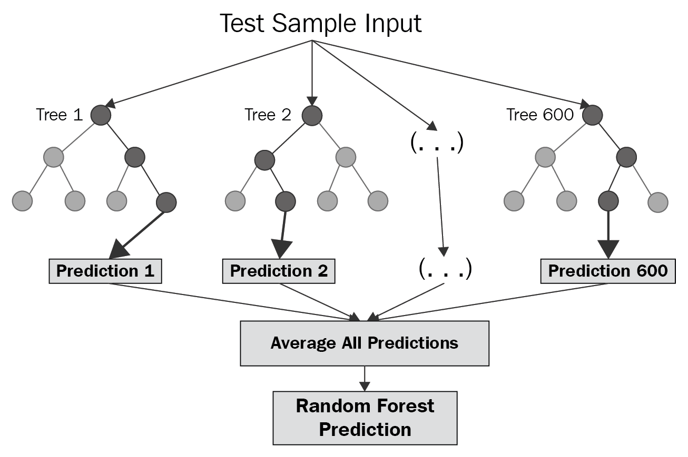
The most important example of Ensemble Learning is Random Forest Classifier. It takes multiple Decision Tree combined to form a better performance Random Forest model.
14. Explain Naive Bayes Classifier and the principle on which it works?
Answer : Naive Bayes Classifier algorithm is a probabilistic model. This model works on the Bayes Theorem principle. The accuracy of Naive Bayes can be increased significantly by combining it with other kernel functions for making a perfect Classifier.
Bayes Theorem – This is a theorem which explains the conditional probability. If we need to identify the probability of occurrence of Event A provided the Event B has already occurred such cases are known as Conditional Probability.
15. What is Imbalanced Data? How do you manage to balance the data?
Answer : If a data is distributed across different categories and the distribution is highly imbalance. Such data are known as Imbalance Data. These kind of datasets causes error in model performance by making category with large values significant for the model resulting in an inaccurate model.
There are various techniques to handle imbalance data. We can increase the number of samples for minority classes. We can decrease the number of samples for classes with extremely high numbers of data points. We can use a cluster based technique to increase number of Data points for all the categories.
16. Explain Unsupervised Clustering approach?
Answer : Grouping the data into different clusters based on the distribution of data is known as Clustering technique.
There are various Clustering Techniques –
1. Density Based Clustering – DBSCAN , HDBSCAN
2. Hierarchical Clustering.
3. Partition Based Clustering
4. Distribution Based Clustering.
17. Explain DBSCAN Clustering technique and in what terms DBSCAN is better than K- Means Clustering?
Answer : DBSCAN( Density Based) clustering technique is an unsupervised approach which splits the vectors into different groups based on the minimum distance and number of points lying in that range. In DBSCAN Clustering we have two significant parameters –
Epsilon – The minimum radius or distance between the two data points to tag them in the same cluster.
Min – Sample Points – The number of minimum sample which should fall under that range to be identified as one cluster.
DBSCAN Clustering technique has few advantages over other clustering algorithms –
1. In DBSCAN we do not need to provide the fixed number of clusters. There can be as many clusters formed on the basis of the data points distribution. While in k nearest neighbour we need to provide the number of clusters we need to split our data into.
2. In DBSCAN we also get a noise cluster identified which helps us in identifying the outliers. This sometimes also acts as a significant term to tune the hyper parameters of a model accordingly.
18. What do you mean by Cross Validation. Name some common cross Validation techniques?
Answer : Cross Validation is a model performance improvement technique. This is a Statistics based approach in which the model gets to train and tested with rotation within the training dataset so that model can perform well for unknown or testing data.
In this the training data are split into different groups and in rotation those groups are used for validation of model performance.
The common Cross Validation techniques are –
K- Fold Cross Validation
Leave p-out Cross Validation
Leave-one-out cross-validation.
Holdout method
19. What is Deep Learning ?
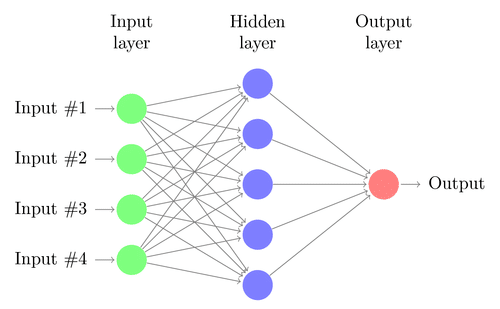
Answer : Deep Learning is the branch of Machine Learning and AI which tries to achieve better accuracy and able to achieve complex models. Deep Learning models are similar to human brains like structure with input layer, hidden layer, activation function and output layer designed in a fashion to give a human brain like structure.
Deep Learning have so many real time applications –
Self Driving Cars
Computer Vision and Image Processing
Real Time Chat bots
Home Automation Systems
20 . Difference between RNN and CNN?
Answer :
| CNN | RNN |
|---|---|
| It is used for distributed data, images. | RNN is used for sequential data. |
| CNN has better performance than RNN | RNN is not having so many features. |
| It requires input and output to be of fixed size. | RNN can take any dimensions data. |
| CNN is a feed forward network with muli layer easy processing network. | RNN is not like a feed-forward mechanism it uses it’s own internal memory. |
| CNNs use patterns between different layers to identify the next results. | Recurrent neural networks use time-series information and process the results based on past memories. |
| Image Processing | Time-series forecasting, Text Classification |
Conclusion
These questions are derived specifically for the Data Science context from multiple interview experiences and also covered in our certification in Data Science. However, it’s recommended apart from these questions to practice the coding skills, SQL, Data Engineering questions, Statistics Questions, and ETL tools questions. Also, understanding the end-to-end Data Science solution from Data extraction to Final UI. These are all the desired skills to be a perfect Data Scientist. Users can put questions in the comments for any further clarifications.





I secured 8 passes grade in my BTech, Oils, UDCT-Mumbai. Sir. Gopalakrishnan Kumar.