As the day was coming to a close, I thought of fitting in another meeting. Two analysts in my team had been working for creating a data set for one of the predictive models we wanted to build. The combined work experience (on predictive modeling) between the analysts was ~ 5 years. I expected to breeze through the meeting and leave for the day.
So, the meeting started. Five minutes into the meeting and I knew that the meeting will take much longer than I initially thought!
The reason? Let’s go through the discussion as it happened:
Kunal: How many rows do you have in the data set?
Analyst 1: (After going through the data set) X rows
Kunal: How many rows do you expect?
Analyst 1 & 2: Blank look at their faces
Kunal: How many events / data points do you expect in the period / every month?
Analyst 1 & 2: …. (None of them had a clue)
The number of rows in the data set looked higher to me. The analysts had missed it clearly, because they did not benchmark it against business expectation (or did not have it in the first place). On digging deeper, we found that some events had multiple rows in the data sets and hence the higher number of rows.
A high percentage of analysts would have gone through similar experience at some point or other in their career.
At times, either due to timeline pressures or due to some other reason, we overlook doing basic sanity checks on the dataset we are working on. However, overlooking data accuracy at initial stages of project can prove very costly and hence usually it pays off to be paranoid about data accuracy.
I usually follow a simple framework for checking accuracy of data points. In this article, I’ll share the process, I typically use for checking data sanity. The framework goes top down, which suits well. If you have any glaring mistakes in the data sets, they would be evident early in the process.
Please note that the remaining article assumes that you are working on a structured data set. For unstructured datasets, while the principles would still apply, but the process would change.
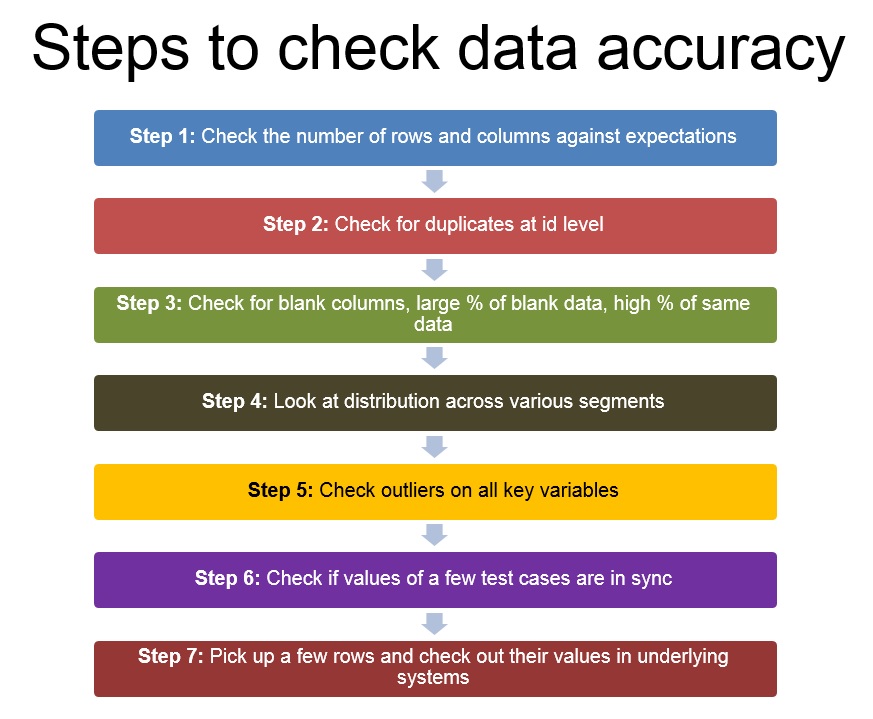
[stextbox id=”section”]Step 1: Check number of columns and rows against expectations [/stextbox]
The first step as soon as you get any data set would be to check whether it has all the required rows and columns. Number of columns would be dictated by the number of hypothesis you have and the variables you would need to prove / dis-prove these hypothesis.
Number of rows on the other hand would be dictated by number of events you expect in the chosen period. The easiest benchmark would be based on your business understanding.
[stextbox id=”section”]Step 2: Check for duplicates at id level (and not for entire row) [/stextbox]
Once you are sure all the columns are present and number of rows look within expected range, quickly check for duplicates at level of your id (or the level at which the rows should be unique – it could be a combination of variables)
[stextbox id=”section”]Step 3: Check for blank columns, large % of blank data, high % of same data [/stextbox]
Now that you know all columns are there and there are no duplicates, look out if there are columns which are entirely blank. This can happen in case some join fails or in case there is some error in data extraction. If none of the columns are blank, look at the % of blank cases by each column and frequency distributions to find out if the same data is being repeated in more cases than expected.
[stextbox id=”section”]Step 4: Look at the distribution across various segments – check against business understanding and use pivot tables[/stextbox]
This step continues where 3 finishes. Instead of looking at frequencies of data points individually, look at their distributions. Do you expect normal, bi-polar or uniform distribution? Does the distribution look like what you expect?
[stextbox id=”section”]Step 5. Check outliers on all key variables – especially the computed ones[/stextbox]
Once the distributions look fine, check for outliers. Especially in cases where you have computed columns. Do the values on extreme look like as you had wanted? Make sure there are no divisions by zero, you have capped the values you would want to.
[stextbox id=”section”]Step 6: Check if values of a few test cases are in sync[/stextbox]
Once you have checked all the columns individually, check whether they are in sync with each other. Check whether various dates of cases are in chronological order (e.g. . Do the balances, spend and credit limit look in sync with each other for your credit card customers?
[stextbox id=”section”]Step 7: Pick up a few rows and check out their values in the underlying systems[/stextbox]
Once all the previous steps are done, it is time to check a few samples by querying the underlying systems or databases. If there was any error in data, you should have ideally identified it by now. This step just ensures that the data is as it was in the underlying systems.
Please note that some of these errors can be spotted through use of logs provided by your tool. Looking at the logs usually provides a lot of information about errors and warnings.
These were the steps I use to check the accuracy of data and they usually help me to spot any glaring errors in the data. Obviously, they are not the answer to every possible error, but they should give you a good starting point and direction. What do you think about this framework? Are there other framework / methods you use to check the accuracy of data? If so, please add them in the comments below.
If you like what you just read & want to continue your analytics learning, subscribe to our emails or like our Facebook page.
Kunal Jain is the Founder and CEO of Analytics Vidhya, one of the world's leading communities of Al professionals. With over 17 years of experience in the field, Kunal has been instrumental in shaping the global Al landscape. His expertise spans diverse markets, from developed economies like the UK to emerging ones like India, where he has successfully led and delivered complex data-driven solutions. As a recognized thought leader, Kunal has empowered countless individuals to realize their Al ambitions through his visionary approach to Al education and community building. Before founding Analytics Vidhya, Kunal earned both his undergraduate and postgraduate degrees from IIT Bombay and held key roles at Capital One and Aviva Life Insurance across multiple geographies. His passion lies at the intersection of analytics, Al, and fostering a thriving community of data science professionals.


Nice steps. Kunal. :) I have something to add. Data files usually need to be combined. Example, the member information and purchase data files are usually stored differently. Hence, before all the cleaning starts, I do suggest to combine the files first so that we can do logic checks across member and purchase files. However, we should expect member id to appear multiple times in the purchase files. In this case, to combine the member and purchase files, it is usually using assignment of member file to purchase file. However, I did come across before that the IT personnel did not provide me full records of either the member or purchase file. To make matters worse, in SPSS, combining by assignment dont show very obviously when both files doesnt match properly by assignment. What I do nowadays is: 1) create a flag column with 1s in the purchase file 2) aggregate the purchase file by member Id and sum the flag. 3) Combine this purchase file with unique member id with the member file 4) Make sure that both files have indicator to check the records are from member or purchase file. 5) Check how many records come from member or purchase or both files. This might not be a neccesary step for some researchers but to me it is vital to ensure that before data cleaning starts, all my files are combined properly.
Completely agreed Jarrod. I almost assumed the scenario described in the start of the article (i.e. the dataset is already prepared and needs to go through a final check). I think data accuracy should be checked after every join takes place. Thanks, Kunal
Very Useful, But i have a query in data cleaning process, our first step is to fill missing values(blanks) or else do we need to find outliers first?if we try to fill missing values, the outliers in the datamay change the mean value ? so can you suggest me which is the best way to proceed?