Overview
- Here’s a quick introduction to building machine learning pipelines using PySpark
- The ability to build these machine learning pipelines is a must-have skill for any aspiring data scientist
- This is a hands-on article with a structured PySpark code approach – so get your favorite Python IDE ready!
Introduction
Take a moment to ponder this – what are the skills an aspiring data scientist needs to possess to land an industry role?
A machine learning project has a lot of moving components that need to be tied together before we can successfully execute it. The ability to know how to build an end-to-end machine learning pipeline is a prized asset. As a data scientist (aspiring or established), you should know how these machine learning pipelines work.
This is, to put it simply, the amalgamation of two disciplines – data science and software engineering. These two go hand-in-hand for a data scientist. It isn’t just about building models – we need to have the software skills to build enterprise-level systems.

So in this article, we will focus on the basic idea behind building these machine learning pipelines using PySpark. This is a hands-on article so fire up your favorite Python IDE and let’s get going!
Note: This is part 2 of my PySpark for beginners series. You can check out the introductory article below:
Table of Contents
- Perform Basic Operations on a Spark Dataframe
- Reading a CSV file
- Defining the Schema
- Data Exploration using PySpark
- Check the Data Dimensions
- Describe the Data
- Missing Values Count
- Find Count of Unique Values in a Column
- Encode Categorical VariablesusingPySpark
- String Indexing
- One Hot Encoding
- Vector Assembler
- Building Machine Learning Pipelines using PySpark
- Transformers and Estimators
- Examples of Pipelines
Perform Basic Operations on a Spark Dataframe
An essential (and first) step in any data science project is to understand the data before building any Machine Learning model. Most data science aspirants stumble here – they just don’t spend enough time understanding what they’re working with. There’s a tendency to rush in and build models – a fallacy you must avoid.
We will follow this principle in this article. I’ll follow a structured approach throughout to ensure we don’t miss out on any critical step.
So first, let’s take a moment and understand each variable we’ll be working with here. We are going to use a dataset from a recently concluded India vs Bangladesh cricket match. Let’s see the different variables we have in the dataset:
- Batsman: Unique batsman id (Integer)
- Batsman_Name: Name of the batsman (String)
- Bowler: Unique bowler id (Integer)
- Bowler_Name: Name of the bowler (String)
- Commentary: Description of the event as broadcasted (String)
- Detail: Another string describing the events such as wickets and extra deliveries (String)
- Dismissed: Unique Id of the batsman if dismissed (String)
- Id: Unique row id (String)
- Isball: Whether the delivery was legal or not (Boolean)
- Isboundary: Whether the batsman hit a boundary or not (Binary)
- Iswicket: Whether the batsman dismissed or not ( Binary)
- Over: Over number (Double)
- Runs: Runs on that particular delivery (Integer)
- Timestamp: Time at which the data was recorded (Timestamp)
So let’s begin, shall we?
Reading a CSV file
When we power up Spark, the SparkSession variable is appropriately available under the name ‘spark‘. We can use this to read multiple types of files, such as CSV, JSON, TEXT, etc. This enables us to save the data as a Spark dataframe.
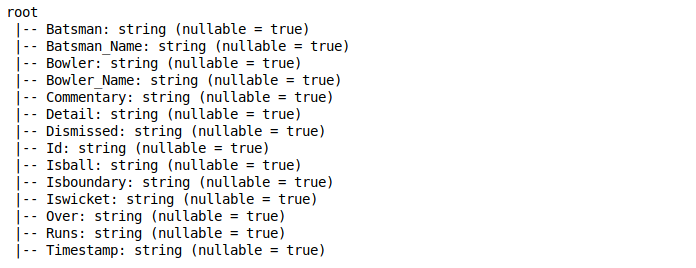
By default, it considers the data type of all the columns as a string. You can check the data types by using the printSchema function on the dataframe:
Defining the Schema
Now, we do not want all the columns in our dataset to be treated as strings. So what can we do about that?
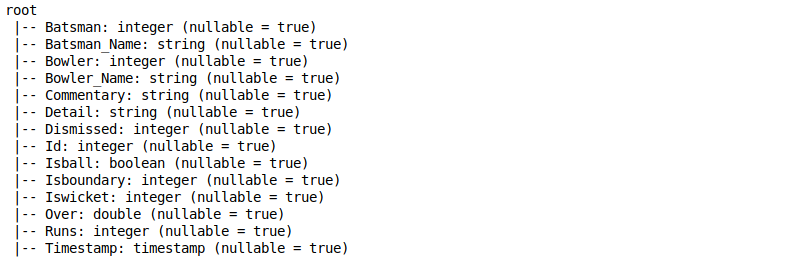
We can define the custom schema for our dataframe in Spark. For this, we need to create an object of StructType which takes a list of StructField. And of course, we should define StructField with a column name, the data type of the column and whether null values are allowed for the particular column or not.
Refer to the below code snippet to understand how to create this custom schema:
Drop columns from the data
In any machine learning project, we always have a few columns that are not required for solving the problem. I’m sure you’ve come across this dilemma before as well, whether that’s in the industry or in an online hackathon.
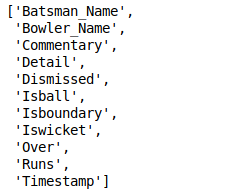
In our instance, we can use the drop function to remove the column from the data. Use the asterisk (*) sign before the list to drop multiple columns from the dataset:
Data Exploration using PySpark
Check the Data Dimensions
Unlike Pandas, Spark dataframes do not have the shape function to check the dimensions of the data. We can instead use the code below to check the dimensions of the dataset:
Describe the Data
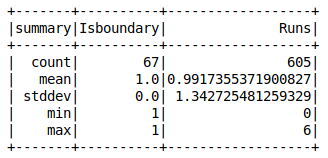
Spark’s describe function gives us most of the statistical results like mean, count, min, max, and standard deviation. You can use the summary function to get the quartiles of the numeric variables as well:
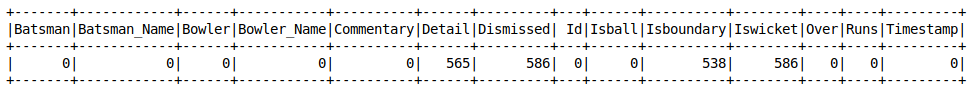
Missing Values Count
It’s rare when we get a dataset without any missing values. Can you remember the last time that happened?
It is important to check the number of missing values present in all the columns. Knowing the count helps us treat the missing values before building any machine learning model using that data.
So, you can use the code below to find the null value count in your dataset:
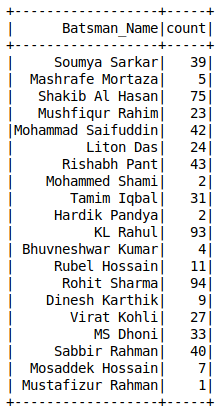
Value Counts of a Column
Unlike Pandas, we do not have the value_counts() function in Spark dataframes. You can use the groupBy function to calculate the unique value counts of categorical variables:
Encode Categorical Variables using PySpark
Most machine learning algorithms accept the data only in numerical form. So, it is essential to convert any categorical variables present in our dataset into numbers.
Remember that we cannot simply drop them from our dataset as they might contain useful information. It would be a nightmare to lose that just because we don’t want to figure out how to use them!
Let’s see some of the methods to encode categorical variables using PySpark.
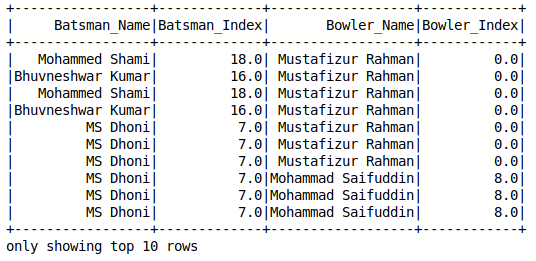
String Indexing
String Indexing is similar to Label Encoding. It assigns a unique integer value to each category. 0 is assigned to the most frequent category, 1 to the next most frequent value, and so on. We have to define the input column name that we want to index and the output column name in which we want the results:
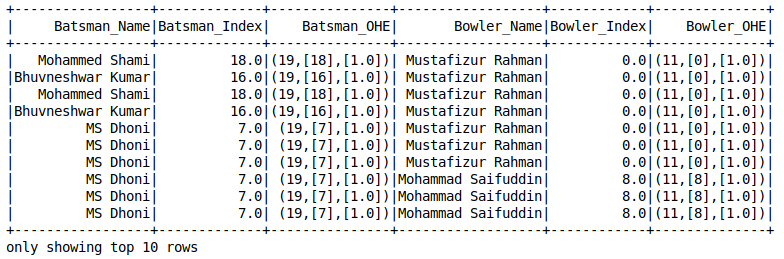
One-Hot Encoding
One-hot encoding is a concept every data scientist should know. I’ve relied on it multiple times when dealing with missing values. It’s a lifesaver!
Here’s the caveat – Spark’s OneHotEncoder does not directly encode the categorical variable.
First, we need to use the String Indexer to convert the variable into numerical form and then use OneHotEncoderEstimator to encode multiple columns of the dataset.
It creates a Sparse Vector for each row:
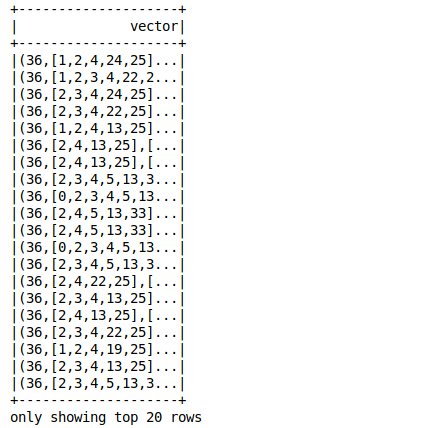
Vector Assembler
A vector assembler combines a given list of columns into a single vector column.
This is typically used at the end of the data exploration and pre-processing steps. At this stage, we usually work with a few raw or transformed features that can be used to train our model.
The Vector Assembler converts them into a single feature column in order to train the machine learning model (such as Logistic Regression). It accepts numeric, boolean and vector type columns:
Building Machine Learning Pipelines using PySpark
A machine learning project typically involves steps like data preprocessing, feature extraction, model fitting and evaluating results. We need to perform a lot of transformations on the data in sequence. As you can imagine, keeping track of them can potentially become a tedious task.
This is where machine learning pipelines come in.
A pipeline allows us to maintain the data flow of all the relevant transformations that are required to reach the end result.
We need to define the stages of the pipeline which act as a chain of command for Spark to run. Here, each stage is either a Transformer or an Estimator.
Transformers and Estimators
As the name suggests, Transformers convert one dataframe into another either by updating the current values of a particular column (like converting categorical columns to numeric) or mapping it to some other values by using a defined logic.
An Estimator implements the fit() method on a dataframe and produces a model. For example, LogisticRegression is an Estimator that trains a classification model when we call the fit() method.
Let’s understand this with the help of some examples.
Examples of Pipelines
Let’s create a sample dataframe with three columns as shown below. Here, we will define some of the stages in which we want to transform the data and see how to set up the pipeline:
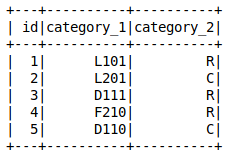
We have created the dataframe. Suppose we have to transform the data in the below order:
- stage_1: Label Encode or String Index the column category_1
- stage_2: Label Encode or String Index the column category_2
- stage_3: One-Hot Encode the indexed column category_2
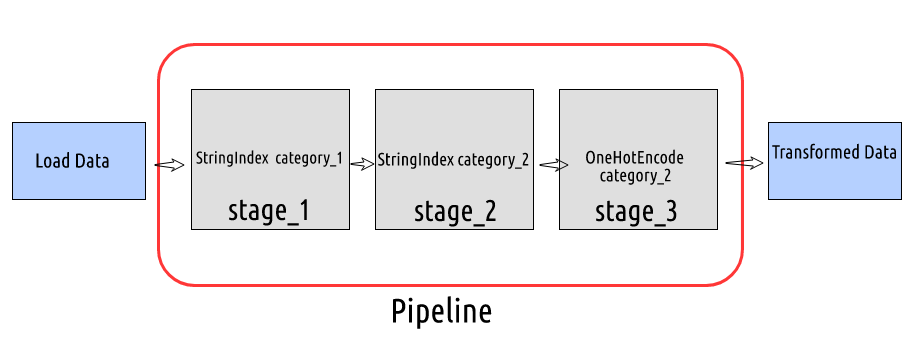
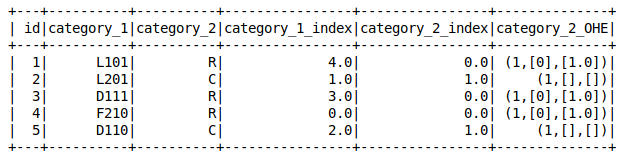
At each stage, we will pass the input and output column name and setup the pipeline by passing the defined stages in the list of the Pipeline object.
The pipeline model then performs certain steps one by one in a sequence and gives us the end result. Let’s see how to implement the pipeline:
Now, let’s take a more complex example of setting up a pipeline. Here, we will do transformations on the data and build a logistic regression model.
For this, we will create a sample dataframe which will be our training dataset with four features and the target label:
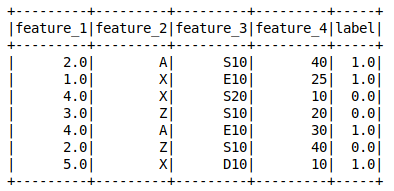
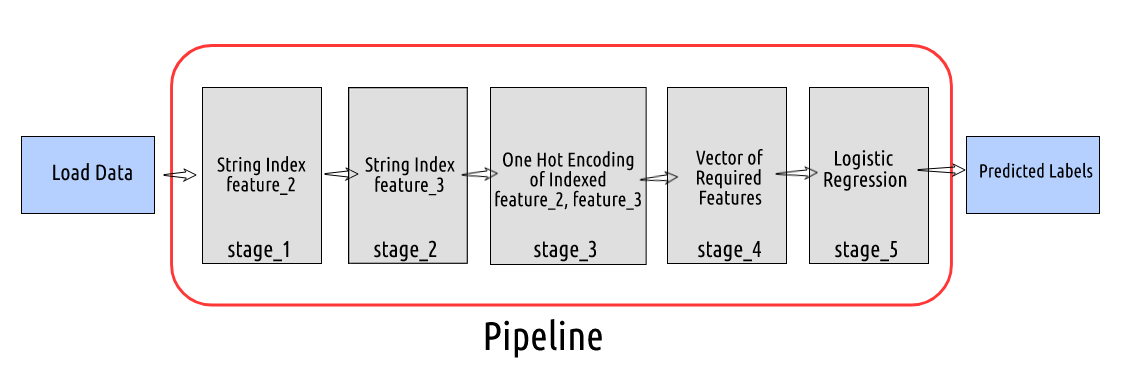
Now, suppose this is the order of our pipeline:
- stage_1: Label Encode or String Index the column feature_2
- stage_2: Label Encode or String Index the column feature_3
- stage_3: One Hot Encode the indexed column of feature_2 and feature_3
- stage_4: Create a vector of all the features required to train a Logistic Regression model
- stage_5: Build a Logistic Regression model
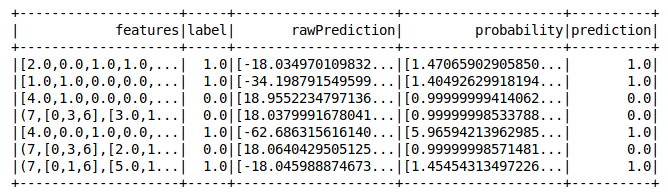
We have to define the stages by providing the input column name and output column name. The final stage would be to build a logistic regression model. And in the end, when we run the pipeline on the training dataset, it will run the steps in a sequence and add new columns to the dataframe (like rawPrediction, probability, and prediction).
Congrats! We have successfully set up the pipeline. Let’s create a sample test dataset without the labels and this time, we do not need to define all the steps again. We will just pass the data through the pipeline and we are done!
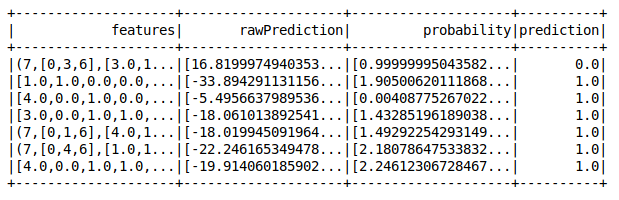
Perfect!
End Notes
This was a short but intuitive article on how to build machine learning pipelines using PySpark. I’ll reiterate it again because it’s that important – you need to know how these pipelines work. This is a big part of your role as a data scientist.
Have you worked on an end-to-end machine learning project before? Or been a part of a team that built these pipelines in an industry setting? Let’s connect in the comments section below and discuss.
I’ll see you in the next article on this PySpark for beginners series. Happy learning!
Ideas have always excited me. The fact that we could dream of something and bring it to reality fascinates me. Computer Science provides me a window to do exactly that. I love programming and use it to solve problems and a beginner in the field of Data Science.


I am getting : IllegalArgumentException: 'Data type string of column Isboundary is not supported.\nData type string of column Iswicket is not supported.\nData type string of column Over is not supported.\nData type string of column Runs is not supported.' for # transform the data final_data = assembler.transform(my_data) Is there a recommendation to solve this error.
Excellent Article. Very clear to understand each data cleaning step even for a newbie in analytics. Thanks a lot for much informative article :)
Thanks for the article, very well explained indeed. I was wondering if you could post the building of pipeline using the same example of cricket match.