Overview
- Feature engineering is a key aspect in acing data science hackathons
- Learn how to perform feature engineering here as we walk through a real-world data science problem
Introduction
Are you new to data science hackathons? Struggling to climb up the leaderboard rankings? I’ve been there and it can be a daunting obstacle if we don’t rely on a few tried and tested techniques. And the most effective (and intriguing) step is feature engineering!
If you haven’t yet tried out feature engineering in hackathons, you’re missing out on a lot of fun. The majority of the winning solutions and approaches we see often have feature engineering at their core. Proven hackathon experts such as SRK and Rohan Rao vouch for the power of feature engineering and how it can propel you right up into the upper echelons of the leaderboard.
I personally love the range of skills I can use to perform feature engineering in data science hackathons. My problem solving, analytics thinking and curiosity – all of these skills are tested.

I strongly believe that feature engineering is quite an under-appreciated part of the art of machine learning. It can be the most time-consuming step in hackathons but the level of creativity it inspires is what data science is all about!
Feature engineering is also one of the key areas where those with domain expertise can shine. We’ll cover all of that in this article, plus implement feature engineering on a real-world data science problem!
I encourage you to participate in Analytics Vidhay’s weekly hackathons – called JanataHack. It’s a golden opportunity to test your data science skills on a global platform and analyze your learning and progress against the top minds in the field.
Table of Contents
- What is Feature Engineering?
- Here’s a list of Guidelines for Feature Engineering in Hackathons
- Predicting Black Friday Sales – Feature Engineering in Action!
What is Feature Engineering?
Feature Engineering is a work of art in data science and machine learning. It refers to creating new features from existing ones, of coming up with new variables from the list your dataset currently has.
Much like industrial processing can extract pure gold from trace elements within raw ore, feature engineering can extract valuable “alpha” from very noisy raw data.

After all, you have to dig through a lot of dirt to find gold. 🙂
Here’s a List of Guidelines For Feature Engineering in Hackathons
Feature engineering is fundamentally a creative process that should not be overly constrained by rules or limits. However, I do believe there are a few guidelines we should follow when performing feature engineering:
- Peeking (into the future) is the “original sin” of feature engineering (and prediction modeling in general). It refers to using information about the future (or information which would not yet be known by us) to engineer a piece of data. This can be obvious, like using next_12_months_returns. However, it’s most often quite subtle, like using the mean or standard deviation across the full-time period to normalize data points (which implicitly leaks future information into our features). The test is whether you would be able to get the exact same value if you were calculating the data point at that point in time rather than today
- A corollary to the above, you also need to be honest about what you would have known at the time, not just what had happened at the time. For instance, short borrowing data is reported by exchanges with a considerable time lag. You would want to stamp the feature with the date on which you would have known it
- Many machine learning algorithms expect that every input feature will have a value (of a certain type) for each observation. If you envision a spreadsheet where each feature is a column and each observation is a row, there should be a value in each cell of the table. Quite often, some features in the table will naturally update themselves more frequently than others. Price data updates almost continuously, while short inventory, analyst estimates, or EBITDA tend to update every few weeks or months. In these cases, we’ll use a scheme like last observation carried forward (LOCF) to always have a value for each feature in the naturally lower frequency columns. Of course, we will be careful to avoid inadvertent peeking!
- Finally, it’s extremely important to represent features in a way that captures ordinality only if it has meaning. For instance, it’s usually a bad idea to represent “day of the week” as an integer (1 to 7) since this implicitly tells the model to treat Friday as very similar to Thursday, but “a little more”. It would also say that Sunday and Monday are totally different (if Sunday = 7 and Monday = 1). We could miss all manner of interesting patterns in the data
Predicting Black Friday Sales – Feature Engineering in Action!
Time to watch feature engineering in action! Let’s first understand the problem statement before we dive into the Python implementation.
Understanding the Problem Statement
A retail company “ABC Private Limited” wants to understand the customer purchase amount against various products of different categories. They want to build a model to predict the purchase amount of customers against various products which will help them to create personalized offers for customers against different products.

Exploring the Dataset
You can download the dataset here. We’ll start by importing the required Python libraries:
Python Code:
#importing libraries
import numpy as np
import pandas as pd
from sklearn.model_selection import train_test_split
from sklearn.preprocessing import MinMaxScaler, LabelEncoder
from sklearn.tree import DecisionTreeRegressor
from sklearn.metrics import mean_squared_error, r2_score
#from math import *
#import xgboost as xgb
#import matplotlib as plt


#These are all the basic libraries required during the whole process. I have included them in one place. Next, we’ll read the data i.e train.csv and test .csv:
train = pd.read_csv("train.csv")
test = pd.read_csv("test.csv")

print(train.head())
Next comes the part of data understanding:
This is what we get as output:

As we can see here, Product_ID, Gender, Age, City_Category, and Stay_In_Current_City_Years are all categorical features. Next, we’ll try to find the number of unique values in each of them:

This shows that Gender, City_Category, Age, and Stay_In_Current_City_Years have a few unique values and product_ID has many unique values.
Calculating Missing Values
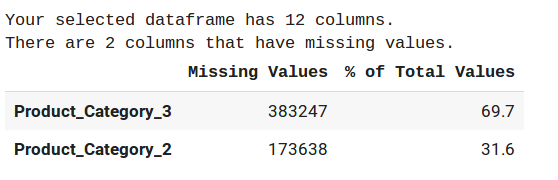
We’ll calculate the percentage of missing values here. If you have participated in any hackathon before, you must be aware of this step:
Here, I have defined a function to calculate the total missing values in a particular column. Then, I created a dataframe to show the result in a tabular format. The result is shown in the descending order of % null values:
Creating Dataframe for submission
Next, create a dataframe for making your hackathon submission:
Data Preparation
Let’s start with the data preparation. We’ll label encode the categorical variable. Here’s an in-depth article to follow if you want to understand what categorical features are and what is the difference between one hot and label encoder: One-Hot Encoding vs. Label Encoding using Scikit-Learn.
We’ll first define dictionaries of unique values in each categorical variable that have a few unique values as explained in the data understanding part. Then, we’ll apply this function to all the values using the apply function.
For the remaining two categorical variables like User_ID and Product_ID, we’ll use the for loop as the number of unique values is quite large and they cannot be defined using dictionaries.
Again, here is an amazing article to learn about the apply and transform functions.
Handling Missing Values
Removing was not a solution as product category_3 has 69.7% values missing. Since product_category is a more general feature, we need to fill the value such that it does not generalize the relationship with the other product_category of the same user. So, let’s fill the values with -999:
Creating a Baseline Model
First, I started by creating a baseline decision tree model i.e. without feature engineering and hyperparameter optimization:
We first make a default decision tree regressor object. Then, we fit the X_train and Y_train to train the model. Next, we predict the results based on the test set. Then we calculate and print the RMSE error and R2 score. Finally, the last section is dedicated to calculating the feature importance. Here’s what we get:

Feature Engineering
Quite a low RMSE score! And now comes feature engineering. This part comes with a lot of practice and validation of features. I’ll start by creating the mean of User_Id and Product_Id:
We are using groupby in conjunction with transform to create the features. This is an amazing technique to create features as it saves time and makes use of less code.
Now I’ll again fit the decision tree model and check feature importance:

This confirms that the features are not redundant and indeed help in understanding the model relation better. I have submitted this model on the public leaderboard:

The variation in RMSE is evident from the fact that this evaluated on the Analytics Vidhya server and the above one on my own personal machine. But the point to consider here is that the rank and RMSE are not that good. We still need to think of other ways.
After seeing the feature importance of mean, we’ll add features like max and min for the user_id and product_id:
Again, we evaluated the decision tree model and calculated the feature importance:

Not much improvement in the RMSE score. As you can see in the baseline model, Product_Category1 has the highest feature importance. So here, we’ll add the max and min feature columns. Along with that, we’ll create a count column for each categorical feature to understand the model relation with features much better:
All these lines of code follow a similar procedure of creating features using the transform function that is defined above. We’ll fit the decision tree model on this dataset and calculate the RMSE score:

This gives a major jump in RMSE. This is what I get after submitting my code on the public leaderboard:

Hyperparameter Optimization
Now comes the part of hyperparameter optimization. I’ll be using gridsearchcv for calculating the optimal hyperparameters. To get an in-depth understanding of hyperparameter tuning, check out this article: Complete Guide to Parameter Tuning in XGBoost with codes in Python.

So, the hyperparameters comes out max_depth=10, min_samples_leaf = 3, min_samples_split = 2. Fitting this decision tree model and calculating RMSE:

Submitting our code on the public leaderboard:

So you can see we have achieved a much better RMSE and a comparatively better rank. Go ahead and try to beat this score!
End Notes
That’s the power of feature engineering! I rely on it by default when I participate in hackathons now. It’s an integral part of my strategy to finish high up the leaderboard rankings.
In this article, we saw a simple code pattern for creating any number of “features” from raw input data, as well as some suggestions for useful transformations and alternative representations. These steps come with a lot of practice. So keep practicing and applying your learning!
Aspiring Data Scientist with a passion to play and wrangle with data and get insights from it to help the community know the upcoming trends and products for their better future.With an ambition to develop product used by millions which makes their life easier and better.


Thanks for a great article. It seems that parts of this article have a strong resemblance to the article found here: https://alphascientist.com/feature_engineering.html A references section at the end of this article to guide readers to other helpful sources (such as the above article) would have been very useful.