Introduction

Photo by Priscilla Du Preez on Unsplash
Natural Language Processing (NLP) is one of the most important fields of study and research in today’s world. It has many applications in the business sector such as chatbots, sentiment analysis, and document classification.
Preprocessing and representing text is one of the trickiest and most annoying parts of working on an NLP project. Text-based datasets can be incredibly thorny and difficult to preprocess. But fortunately, the latest Python package called Texthero can help you solve these challenges.
What is Texthero?
Texthero is a simple Python toolkit that helps you work with a text-based dataset. It provides quick and easy functionalities that let you preprocess, represent, map into vectors, and visualize text data in just a couple of lines of code.

Texthero Logo
Texthero is designed to be used on top of pandas, so it makes it easier to preprocess and analyze text-based Pandas Series or Dataframes.
If you are working on an NLP project, Texthero can help you get things done faster than before and gives you more time to focus on important tasks.
NOTE: The Texthero library is still in the beta version. You might face some bugs and pipelines might change. A faster and better version will be released and it will bring some major changes.
Texthero Overview

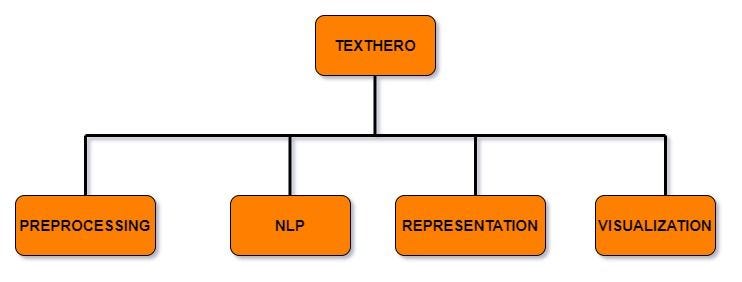
Texthero has four useful modules that handle different functionalities that you can apply in your text-based dataset.
- Preprocessing
This module allows for the efficient pre-processing of text-based Pandas Series or DataFrames. It has different methods to clean your text dataset such as lowercase(), remove_html_tags() and remove_urls(). - NLP
This module has a few NLP tasks such as named_entities, noun_chunks, and so on. - Representation
This module has different algorithms to map words into vectors such as TF-IDF, GloVe, Principal Component Analysis(PCA), and term_frequency. - Visualization
The last module has three different methods to visualize the insights and statistics of a text-based Pandas DataFrame. It can plot a scatter plot and word cloud.
Install Texthero
Texthero is free, open-source, and well documented. To install it open a terminal and execute the following command:
pip install texthero
The package uses a lot of other libraries on the back-end such as Gensim, SpaCy, scikit-learn, and NLTK. You don’t need to install them all separately, pip will take care of that.
How to use Texthero
In this article, I will use a new dataset to show you how you can use different methods provided by texthero’s modules in your own NLP project.
We will start by importing important Python packages that we are going to use.
#import important packages
import texthero as hero
import pandas as pd
Then we’ll load a dataset from the data directory. The dataset for this article focuses on news in the Swahili Language.
#load dataset
data = pd.read_csv("data/swahili_news_dataset.csv")
Let’s look at the top 5 rows of the dataset:
# show top 5 rows
data.head()
As you can see, in our dataset we have three columns (id, content, and category). For this article, we will focus on the content feature.
# select news content only and show top 5 rows
news_content = data[["content"]]
news_content.head()
We have created a new dataframe focused on content only, and then we’ll show the top 5 rows.
Preprocessing with Texthero.
We can use the clean(). method to pre-process a text-based Pandas Series.
# clean the news content by using clean method from hero package
news_content['clean_content'] = hero.clean(news_content['content'])
The clean() method runs seven functions when you pass a pandas series. These seven functions are:
- lowercase(s): Lowercases all text.
- remove_diacritics(): Removes all accents from strings.
- remove_stopwords(): Removes all stop words.
- remove_digits(): Removes all blocks of digits.
- remove_punctuation(): Removes all string.punctuation (!”#$%&’()*+,-./:;<=>?@[]^_`{|}~).
- fillna(s): Replaces unassigned values with empty spaces.
- remove_whitespace(): Removes all white space between words
Now we can see the cleaned news content.
#show unclean and clean news content
news_content.head()
Custom Cleaning
If the default pipeline from the clean() method does not fit your needs, you can create a custom pipeline with the list of functions that you want to apply in your dataset.
As an example, I created a custom pipeline with only 5 functions to clean my dataset.
#create custom pipeline
from texthero import preprocessing

custom_pipeline = [preprocessing.fillna,
                   preprocessing.lowercase,
                   preprocessing.remove_whitespace,
                   preprocessing.remove_punctuation,
                   preprocessing.remove_urls,
                   ]
Now I can use the custom_pipeline to clean my dataset.
#altearnative for custom pipeline
news_content['clean_custom_content'] = news_content['content'].pipe(hero.clean, custom_pipeline)
You can see the clean dataset we have created by using the custom pipeline.
# show output of custom pipeline
news_content.clean_custom_content.head()
Useful preprocessing methods
Here are some other useful functions from preprocessing modules that you can try to clean your text-based dataset.
-
Remove Digits
You can use the remove_digits() function to remove digits in your text-based datasets.
text = pd.Series("Hi my phone number is +255 711 111 111 call me at 09:00 am")
clean_text = hero.preprocessing.remove_digits(text)

print(clean_text)
output: Hi my phone number is + call me at : am
dtype: object -
Remove Stopwords
You can use the remove_stopwords() function to remove stopwords in your text-based datasets.
text = pd.Series("you need to know NLP to develop the chatbot that you desire")
clean_text = hero.remove_stopwords(text)print(clean_text)
output: need know NLP develop chatbot desire
dtype: object -
Remove URLs
You can use the remove_urls() function to remove links in your text-based datasets.
text = pd.Series("Go to https://www.freecodecamp.org/news/ to read more articles you like")
clean_text = hero.remove_urls(text)print(clean_text)
output: Go to read more articles you like
dtype: object -
Tokenize
Tokenize each row of the given Pandas Series by using the tokenize() method and return a Pandas Series where each row contains a list of tokens.
text = pd.Series(["You can think of Texthero as a tool to help you understand and work with text-based dataset. "])
clean_text = hero.tokenize(text)print(clean_text)
output: [You, can, think, of, Texthero, as, a, tool, to, help, you, understand, and, work, with, text, based, dataset] dtype: object
-
Remove HTML Tags
You can remove HTML tags from the given Pandas Series by using the remove_html_tags() method.
text = pd.Series("<html><body><h2>hello world</h2></body></html>")
clean_text = hero.remove_html_tags(text)print(clean_text)
output: hello world
dtype: object
Useful visualization methods
Texthero contains different methods to visualize the insights and statistics of a text-based Pandas DataFrame.
-
Top Words
If you want to know the top words in your text-based dataset, you can use the top_words() method from the visualization module. This method is useful if you want to see additional words that you can add to the stop word lists.
This method does not return a bar graph, so I will use matplotlib to visualize the top words in a bar graph.
import matplotlib.pyplot as pltNUM_TOP_WORDS = 20top_20 = hero.visualization.top_words(news_content['clean_content']).head(NUM_TOP_WORDS)# Draw the bar charttop_20.plot.bar(rot=90, title="Top 20 words");plt.show(block=True);
In the graph above we can visualize the top 20 words from our news dataset.
-
Wordcloud
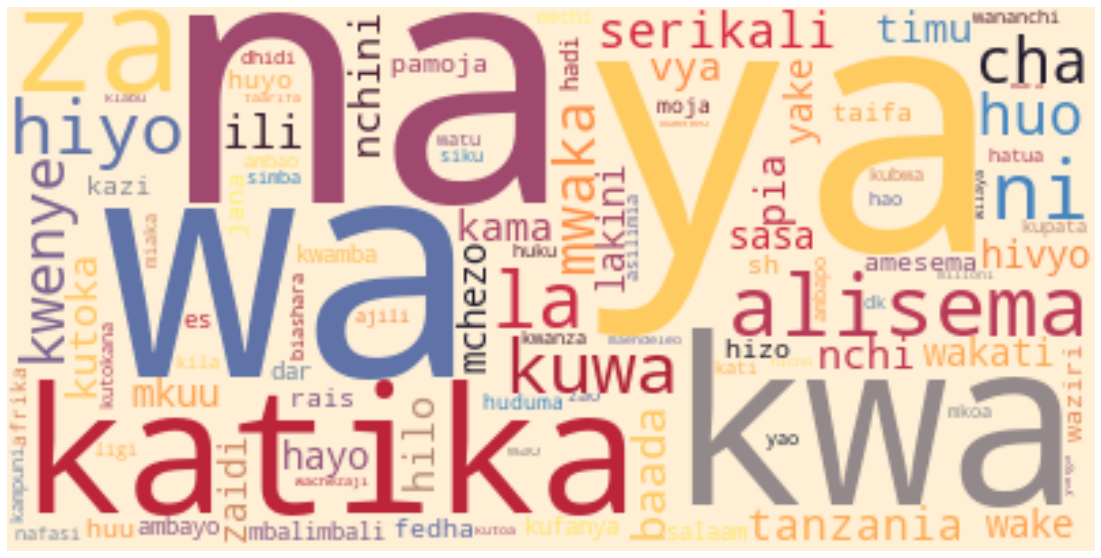
The wordcloud() method from the visualization module plots an image using WordCloud from the word_cloud package.
#Plot wordcloud image using WordCloud method
hero.wordcloud(news_content.clean_content, max_words=100,)
We passed the dataframe series and number of maximum words (for this example, it is 100 words) in the wordcloud() method.

Useful representation methods
Texthero contains different methods from the representation module that help you map words into vectors using different algorithms. Such as TF-IDF, word2vec, or GloVe. In this section, I will show you how you can use these methods.
-
TF-IDF
You can represent a text-based Pandas Series using TF-IDF. I created a new pandas series with two pieces of news content and represented them in TF_IDF features by using the tfidf() method.
# Create a new text-based Pandas Series.news = pd.Series(["mkuu wa mkoa wa tabora aggrey mwanri amesitisha likizo za viongozi wote mkoani humo kutekeleza maazimio ya jukwaa la fursa za biashara la mkoa huo", "serikali imetoa miezi sita kwa taasisi zote za umma ambazo hazitumii mfumo wa gepg katika ukusanyaji wa fedha kufanya hivyo na baada ya hapo itafanya ukaguzi na kuwawajibisha"])#convert into tfidf features
hero.tfidf(news)
output: [0.187132760851739, 0.0, 0.187132760851739, 0….
[0.0, 0.18557550845969953, 0.0, 0.185575508459…
dtype: objectNOTE: TF-IDF stands for term frequency-inverse document frequency.
-
Term Frequency
You can represent a text-based Pandas Series using the term_frequency() method. Term frequency (TF) is used to show how frequently an expression (term or word) occurs in a document or text content.
news = pd.Series(["mkuu wa mkoa wa tabora aggrey mwanri amesitisha likizo za viongozi wote mkoani humo kutekeleza maazimio ya jukwaa la fursa za biashara la mkoa huo", "serikali imetoa miezi sita kwa taasisi zote za umma ambazo hazitumii mfumo wa gepg katika ukusanyaji wa fedha kufanya hivyo na baada ya hapo itafanya ukaguzi na kuwawajibisha"])# Represent a text-based Pandas Series using term_frequency.
hero.term_frequency(news)
output: [1, 0, 1, 0, 1, 0, 1, 0, 0, 0, 0, 1, 1, 0, 0, …
[0, 1, 0, 1, 0, 1, 0, 1, 1, 1, 1, 0, 0, 1, 1, …
dtype: object -
K-means
Texthero can perform the K-means clustering algorithm by using the kmeans() method. If you have an unlabeled text-based dataset, you can use this method to group content according to their similarities.
In this example, I will create a new pandas dataframe called news with the following columns content,tfidf, and kmeans_labels.
column_names = ["content","tfidf", "kmeans_labels"]news = pd.DataFrame(columns = column_names)
We will use only the first 30 pieces of cleaned content from our news_content dataframe and cluster them into groups by using the kmeans() method.
# collect 30 clean content.
news["content"] = news_content.clean_content[:30]# convert them into tf-idf features.
news['tfidf'] = (
    news['content']
    .pipe(hero.tfidf)
)# perform clustering algorithm by using kmeans()
news['kmeans_labels'] = (
    news['tfidf']
    .pipe(hero.kmeans, n_clusters=5)
    .astype(str)
)
In the above source code, in the pipeline of the k-means method, we passed the number of clusters which is 5. This means we will group these contents into 5 groups.
Now the selected news content has been labeled into five groups.
# show content and their labels news[["content","kmeans_labels"]].head() -
PCA
You can also use the pca() method to perform principal component analysis on the given Pandas Series. Principal component analysis (PCA) is a technique for reducing the dimensionality of your datasets. This increases interpretability but at the same time minimizes information loss.
In this example, we use the tfidf features from the news dataframe and represent them into two components by using the pca() method. Finally, we will show a scatterplot by using the scatterplot() method.
#perform pca
news['pca'] = news['tfidf'].pipe(hero.pca)#show scatterplot
hero.scatterplot(news, 'pca', color='kmeans_labels', title="news")
Wrap up
In this article, you’ve learned the basics of how to use the Texthero toolkit Python package in your NLP project. You can learn more about the methods available in the documentation.
You can download the dataset and notebook used in this article here – Davisy/Texthero-Python-Toolkit
If you learned something new or enjoyed reading this article, please share it so that others can see it. I can also be reached on Twitter @Davis_McDavid
This article was first published on freecodecamp.
About the Author

Davis David – Data Scientist
Davis David is the Data scientist with a background in Computer Science. He is passionate about Artificial Intelligence, Machine Learning, Deep Learning, and Big Data. Davis is the Co-Organizer and Facilitator of the Artificial Intelligence (AI) movement in Tanzania. He conducts AI meetups, workshops, and events with a passion to build a community of Data Scientists in Tanzania to solve our local problems. Also, he organized Pythontz and Tanzania Lab Community and became Ambassador of ZindiAfrica in Tanzania.


