This article was published as a part of the Data Science Blogathon.
Introduction
Airbnb is an online marketplace that lets people rent out their properties or spare rooms to guests. Airbnb takes 3% commission of every booking from hosts, and between 6% and 12% from guests.
Since the company launched in 2009, it’s grown from helping 21,000 guests a year find a place to stay to helping six million a year go on holiday, and currently lists a staggering 800,000 properties in 34,000 cities across 90 different countries.

In this article, I will use the Kaggle New York City Airbnb Open Data dataset and try to build a neural network model with TensorFlow for prediction.
The goal is to build a suitable machine learning model that will be able to predict prices of further accommodation data.

Throughout this article, I will be showing insights from the Jupyter notebook I created. You can find it on GitHub.
Loading the Data
For starters, let’s look at loading the data. We’re pulling the data straight off the Kaggle website using wget. Note the -o flag indicating the filename.

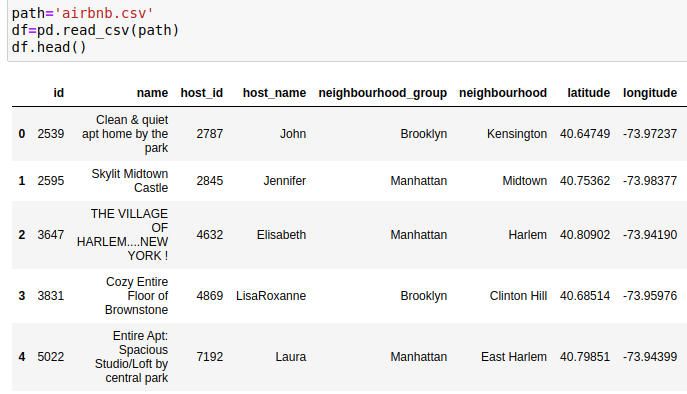
The dataset should look like this. It has 48,895 rows and 16 columns in total. It’s got everything we need.
Data Analysis and Preprocessing
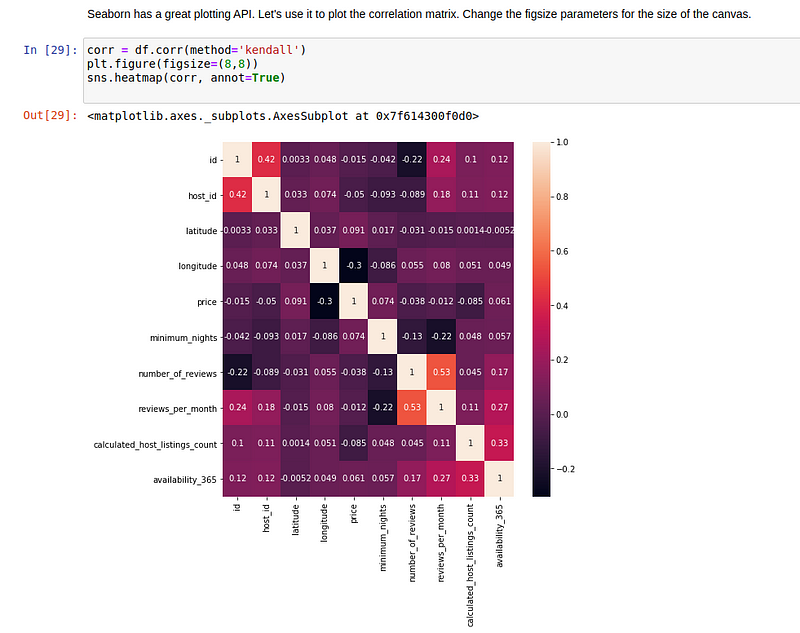
Seaborn has a very neat API for plotting all sorts of graphs for all sorts of data. If you’re not comfortable with the syntax, feel free to check this article.
After using the correlation on the pandas dataframe, we passed it to a heatmap function. This is the outcome:
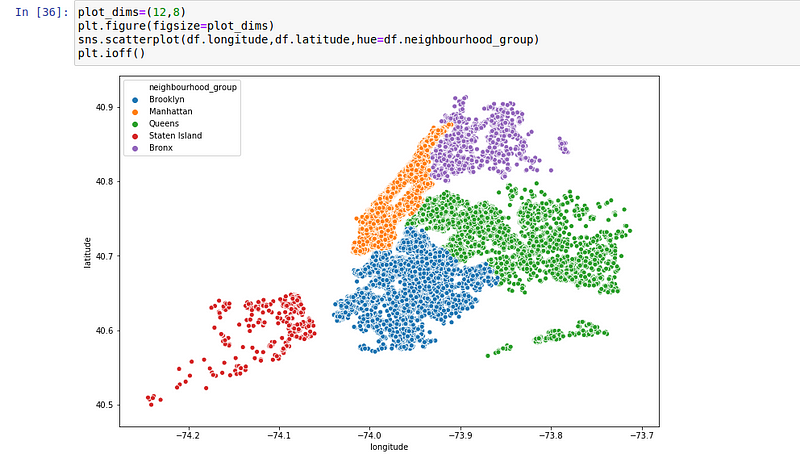
Since we have both the longitude and the longitude as well as the neighbourhood data, let’s create a scatterplot:
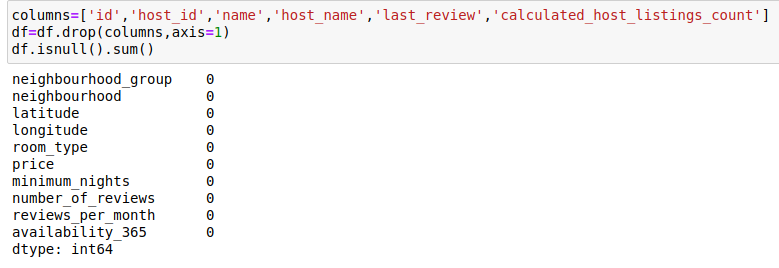
Furthermore, I removed the duplicates and some unnecessary columns and filled the column ‘reviews_per_month’ because it had too many missing values. The data looks like this. It has 10 columns and no zero values:
Great, right?
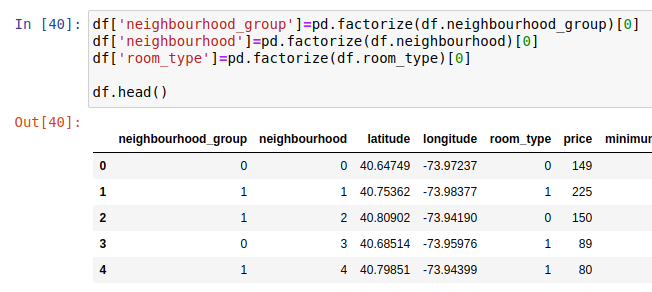
First of all, computers do numbers. That’s why we have to convert categorical columns into one-hot encoded vectors. This is done using the pandas’ factorize method. You could have used a lot of other tools for this:
For the sake of keeping the loss function in stable limits, let’s normalize some of the data so that the mean is 0 and the standard deviation is 1.
Feature Cross
There is one change that we have to make and this is an essential one. In order for the longitude and latitude to be correlated to the model output, we have to create a feature cross. The links below should provide you with enough context to get a proper feel for feature crosses:
- https://developers.google.com/machine-learning/crash-course/feature-crosses/video-lecture
- https://www.kaggle.com/vikramtiwari/feature-crosses-tensorflow-mlcc
Our goal here is to feature cross longitude and latitude, which is one of the oldest tricks in the book. If we merely put the two columns as values to the model, it will assume those values are progressively related to the output.
Instead, we’ll be using a feature cross, meaning we will split the longitude*langitude map into a grid. Quite a delicate little problem. Lucky for us, TensorFlow makes it easy.
I’m making a grid of equally spread frames by iterating from the minimum to the maximum value with an iteration of (max-min)/100.
I’m using a 100×100 grid:
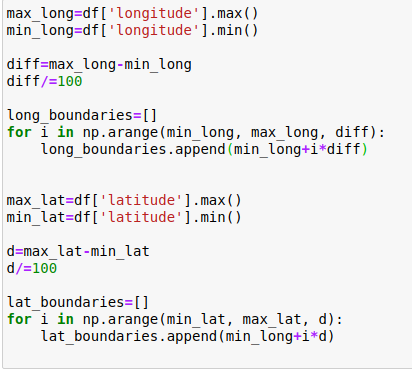
Essentially, what we’re doing here, is defining a bucketed column with boundaries defined earlier and creating a DenseFeatures layer, which will be passed to the Sequential API later.
If you’re not familiar with the Tensorflow syntax, do check the docs:
https://www.tensorflow.org/api_docs/python/tf/feature_column/

Now, finally, we are ready for model training. Except for splitting the data part, that is.

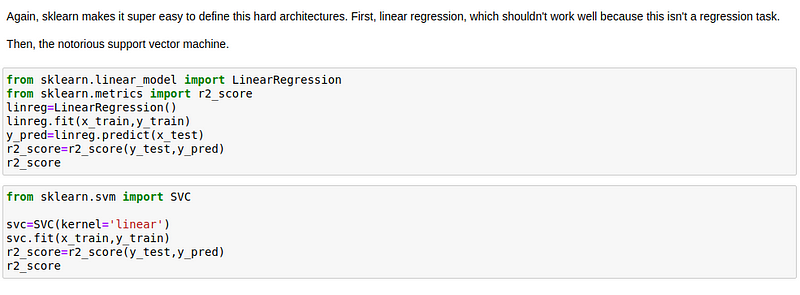
Obviously, we have to create two datasets, one containing all the data and the other the predicted score. Since data sizes don’t match and that could represent issues to our model, I’ve decided to truncate the one that’s too long.
Creating a Model
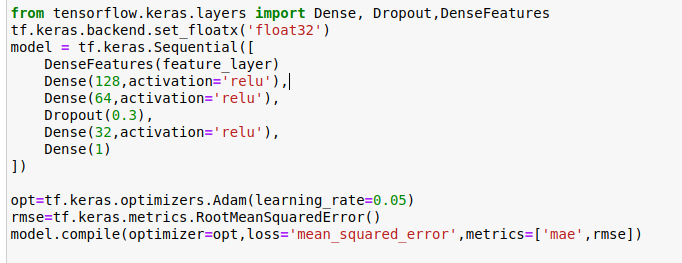
Finally, the creation of the the Keras Sequential model.
We’re compiling the model using the Adam optimizer, mean squared error loss and two metrics. Keep track of these while the model trains.
Additionally, we are using two callbacks:
- EarlyStopping, which is self-explanatory, but check the docs
- Reduce the learning rate on plateau. Definitely check the docs on this one

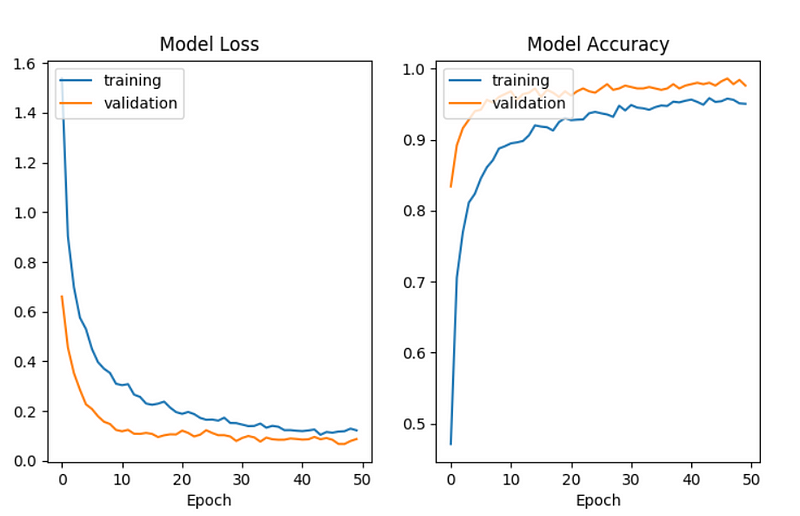
After training for 50 epochs with a batch size of 64, our model was quite successful.
End Notes
We have used the AirBnB data for the city of New York to build a dense neural network for predicting further prices. Pandas and seaborn made it super easy to visualize and inspect the data. We introduced the idea of a feature cross between longitude and latitude as a feature to our model. Thanks to Kaggle’s open datasets, we have derived a fully-operational machine learning model.


