This article was published as a part of the Data Science Blogathon.
Introduction
Clustering is the process of grouping similar data together. It falls under the category of unsupervised learning, that is the input data does not have labeled responses. Clustering algorithms find their applications in various fields like finance, medicine, and e-commerce. One such example is in e-commerce a possible use case would be to group similar customer segments based on their purchasing styles to give them offers or discounts.
In clustering every data point belongs to some cluster however a single data point cannot be present in more than one cluster. The performance of a clustering algorithm can be measured by metrics such as the Dunn index (DI). A large inter-cluster distance(well separated) and a smaller inter-cluster distance(compact) clusters have a higher value of DI.
Different approaches can be employed in clustering based on your dataset, such as
- Centroid based clustering
- Hierarchical clustering/Connectivity based clustering
- Density-based clustering
We would focus on centroid-based clustering in this article.
Centroid based clustering
K means algorithm is one of the centroid based clustering algorithms. Here k is the number of clusters and is a hyperparameter to the algorithm. The core idea behind the algorithm is to find k centroids followed by finding k sets of points which are grouped based on the proximity to the centroid such that the squared distances of the points in the cluster to the centroid are minimized. This optimization is a very hard problem hence an approximation is used to solve the problem. One such approximation is Lloyd’s algorithm whose implementation is as below.
Implementation:-
- Select k points at random as centroids/cluster centers.
- Assign data points to the closest cluster based on Euclidean distance
- Calculate centroid of all points within the cluster
- Repeat iteratively till convergence. (Same points are assigned to the clusters in consecutive iterations)
The only problem with this implementation however is that it suffers from initialization sensitivity. On selecting different centroids in the initialization stage different clusters are generated. Workaround to the problem would be
- to repeat k means multiple times with different initializations and select the best result.
- instead of using random initialization to use a smart initialization process such as K means ++.
In some cases it is difficult to interpret centroids, for example, if you are dealing with text data, centroids are not interpretable. An approach to deal with this would be to use the K medoids algorithm. It would select the most centered member within the data as a cluster center and is generally more robust to outliers than other means.
You may wonder how is the best value for k is selected?
Elbow or knee method is used to determine the best k. We try the k means implementation for multiple k values and plot them against our sum of squared distances from the centroid(loss function). The elbow of the curve (where the curve visibly bends) is selected as the optimum k.
Advantages of using K means:-
- The algorithm in most cases runs in linear time.
- Simple and intuitive to understand
Limitations of using K means:-
- A number of clusters need to be known beforehand.
- It is not very robust to outliers.
- Does not work very well with nonconvex shapes.
- Tries to generate equal-sized clusters
Let’s run through a code example of K means in action.
- We would be using the sklearn implementation of k means for this example.
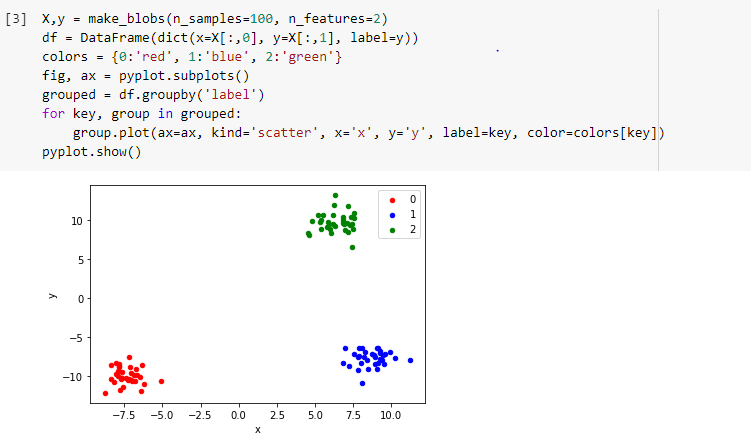
- As input, I have generated a dataset in python using sklearn.datasets.make_blobs.
- We have a hundred sample points and two features in our input data with three centers for the clusters.
- We then fit our data to the K means clustering model as implemented by sklearn.
- We have used our initialization method to be k means++ instead of random and set our k to be 3
Try out the above code in the live coding window below:
from sklearn.datasets import make_blobs
from matplotlib import pyplot
from pandas import DataFrame
X,y = make_blobs(n_samples=100, n_features=2)
df = DataFrame(dict(x=X[:,0], y=X[:,1], label=y))
colors = {0:'red', 1:'blue', 2:'green'}
fig, ax = pyplot.subplots()
grouped = df.groupby('label')
for key, group in grouped:
group.plot(ax=ax, kind='scatter', x='x', y='y', label=key, color=colors[key])
#
print(df)
print("Columns \n\n")
print(df.columns)
df_X = df[['x','y']]
df_X
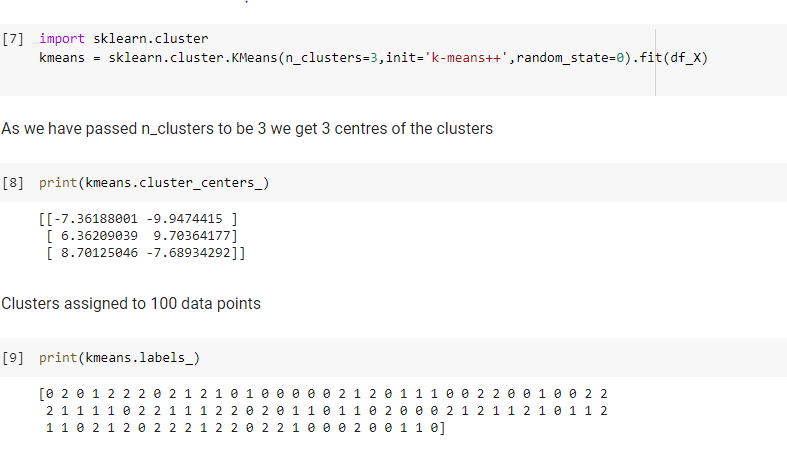
import sklearn.cluster
kmeans = sklearn.cluster.KMeans(n_clusters=3,init='k-means++',random_state=0).fit(df_X)
print("\n\n Cluster Center: \n\n ")
print(kmeans.cluster_centers_)
print("\n\n Lables")
print(kmeans.labels_)
- We can see the three centers of clusters printed and kmeans.labels_ gives us the cluster each of our hundred points is assigned to.
- To better visualize this we use the below code to represent the clusters graphically.
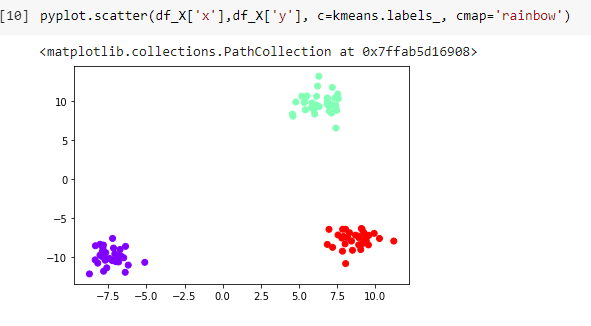
We can see that our k means algorithm did a very good job in clustering our dataset.
For the entire code snippet:- https://www.kaggle.com/aliphya/k-means-clustering-example
Thank you for reading along, I am Alicia Ghantiwala a data science enthusiast and a software engineer at BNP Paribas.
My LinkedIn profile:- https://www.linkedin.com/in/alifia-ghantiwala-683403135/
The media shown in this article are not owned by Analytics Vidhya and is used at the Author’s discretion.


