This article was published as a part of the Data Science Blogathon.
What is Exploratory Data Analysis?
The very first step in data science is exploratory data analysis, aka EDA. All types of data models do not fit all data types, so it is better to thoroughly analyze the data before proceeding further. For example, mathematical operations cannot be applied to categorical data, or the issue of missing values in the dataset must be addressed.
The accuracy of the data model directly depends on the quality of the data. However, in the real-world, data is collected from various sources and must be handled accordingly to reduce the repercussions.
EDA being the initial step of data mining, helps in getting insight into data without any assumptions. This helps in forming the hypotheses. The fundamental ingredients of EDA are data summarization, data description and inferences, and data visualization.
The traditional way of doing EDA in Python involves tools such as NumPy, Pandas, Scipy, and Matplotlib. However, a quick sneak peek into data can be done using Sweetviz.
Introduction to Sweetviz 2.0
Sweetviz 2.0 is an open-source pandas-based library to perform the primary EDA task without much hassle or with just two lines of code. It also generates a summarised report with great visualizations.
Installation using pip
The basic command to install a package using pip is:
pip install sweetviz
Alternatively, use the following command inside Notebook/Colab
!pip install sweetviz
How to Use?
Let us get our hands dirty and start writing the code… (Feel free to use the source code here)
For this purpose, we will be using the Student Performance dataset (get it here). It is mixed data, that is, both numerical and categorical data are present. The dataset consists of 1000 students record with a total of eight features, viz.,
- gender: categorical
- race/ethnicity: categorical
- parental level of education: categorical
- lunch: categorical
- test preparation course: categorical
- math score: numerical
- reading score: numerical; and
- writing score: numerical
We will be using pandas for reading the csv (Comma Separated Values) file.
import pandas as pd
data=pd.read_csv('StudentsPerformance.csv')
# Printing data insights
print(data.info())
# Printing few data samples
print(data.head(5))
Sweetviz has a powerful function called analyze() that helps in analyzing the data at a glance.
# Analyzing data
report=sv.analyze(data)
# Generating report
report.show_html('eda_report.html')
Bang! Our report is ready in a split second.
The function show_html() generates a detailed report consisting of the following details:
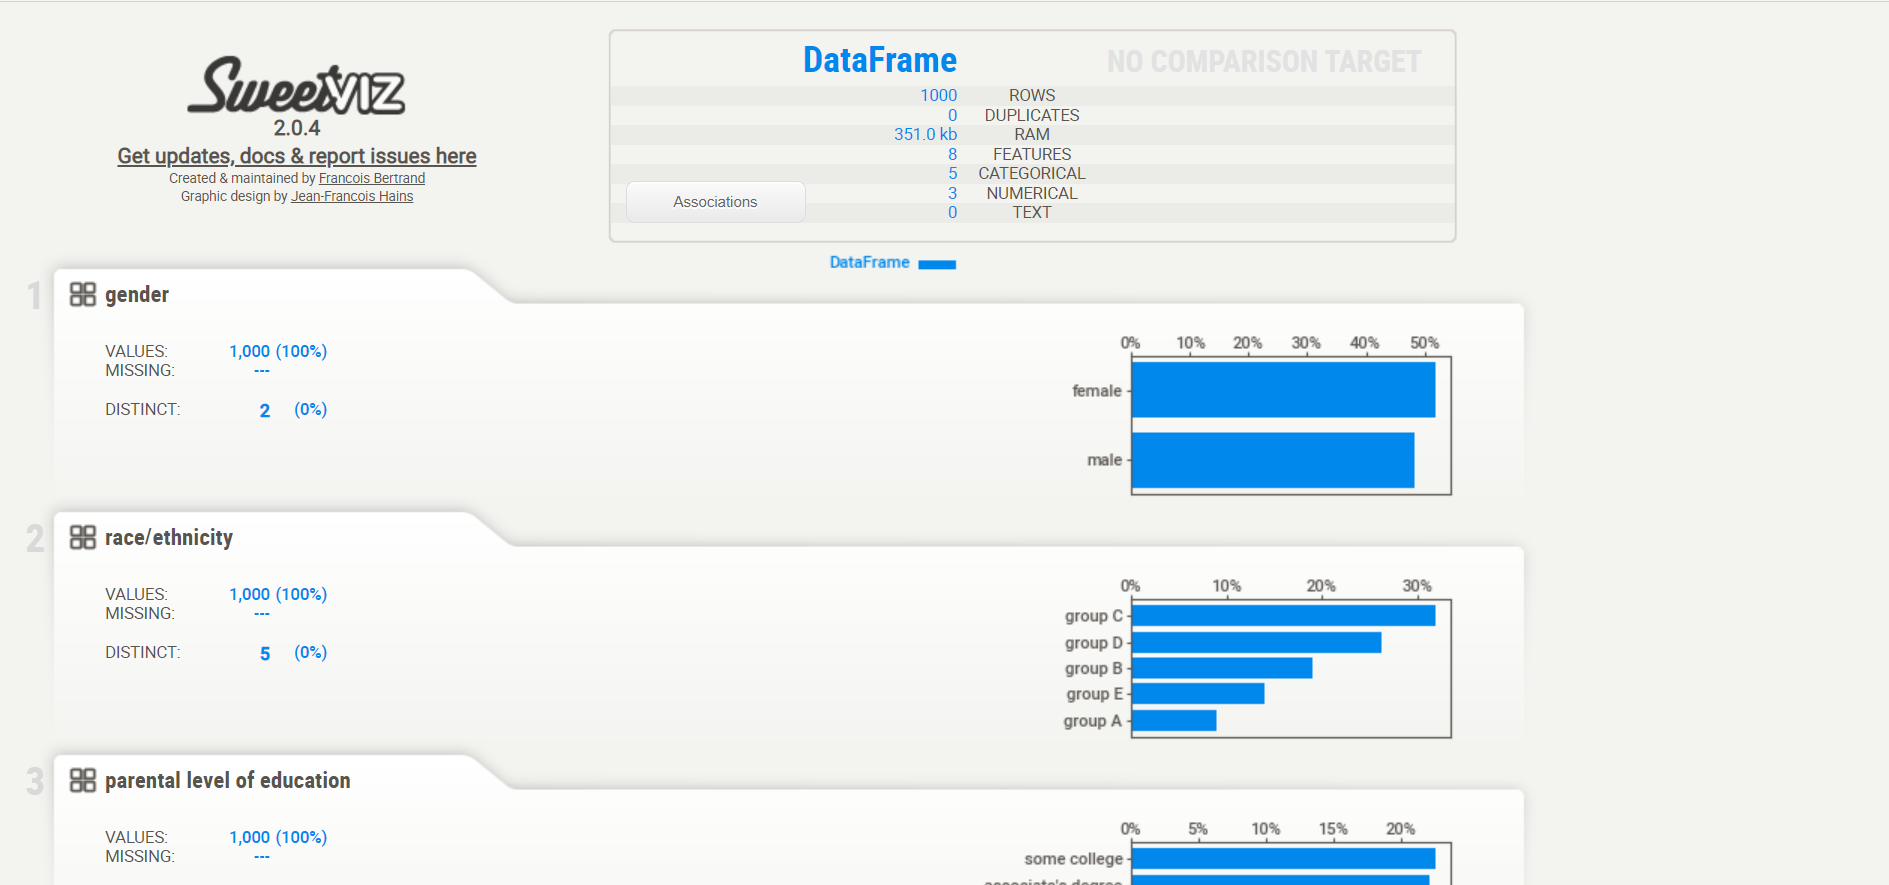
.png)
If show_html() function is not supplied with any parameter, by default, it generates a file named ‘SWEETVIZ_REPORT.html’.
Apart from this, we can compare two datasets side-by-side. To have a glance at this, we would split the dataset into two halves.
# Spliting the data into two datasets
data1=data[0:400]
data2=data[400:]
Now, let us compare both of them side-by-side using
report_comp=sv.compare([data1,'DATA1'],[data2,'DATA2'])
report_comp.show_html('Compare_Results.html')
.png)
If the function compare() is left with default parameters, refer to the two datasets by Dataframe and Compared, respectively.
.png)
We can also perform target analysis, but currently, it only supports numerical or binary targets, rather than categorical targets. Let’s consider math scores as a target:
report_comp=sv.compare(data1,data2,'math score')
report_comp.show_html('Compare_Results.html')
.png)
Version 1.0 vs 2.0
Although working with Sweetviz makes EDA hassle-free, it does introduce some difficulties as well.
Firstly, the reports generated using the base OS module; hence it is incompatible with custom environments such as Google Colab. Secondly, the reports are in HTML format; therefore, the graphs cannot be plotted inline.
However, in version 2.0, these issues have been taken care of by a new feature show_notebook() which embeds the visualizations in the notebooks using an iframe. Also, you’ll be able to save a report in HTML format that could be accessed later.
Playing with Reports
The additional yet optional parameters make this task easy.
Version 2.0 allows the user to manipulate the appearance of the report with some parameters as –
 report_comp.show_html(filepath='report.html',
open_browser=True,
layout='vertical',
scale=0.7)
.png)
Another feature introduced in version 2.0 called show_notebook() displays the report within the notebook environment rather than any browser-based external environment using an IFRAME HTML element. Typical usage of this feature is demonstrated by the following lines of code –
report_comp.show_notebook(w=None, h=None,
scale=None,
layout='vertical',
filepath='E:/sweetviz_report.html')
.png)
where,
w and h: signifies the width and height of the window. It can be defined in absolute pixels (e.g. 400) or relatively (e.g. 70%).
filepath: saves the file in the directory with the name specified which can be accessed later
layout: there are two layout modes available, viz., widescreen and vertical
scale: this defines the scale of the report within the window. It is a fractional number ranging from 0 to 1.
Conclusion
In this short article, I outlined how to load data using pandas and have quick insights on the data using Sweetviz 2.0 in just a couple of lines of code.
References
- https://pypi.org/project/sweetviz/ [accessed: Jan-05-2021]
- https://www.kaggle.com/spscientist/students-performance-in–exams?select=StudentsPerformance.csv [accessed Jan-05-2021]
The media shown in this article are not owned by Analytics Vidhya and is used at the Author’s discretion.
Apart from being a programmer, I am a full-time researcher exploring into cutting-edge technologies, constantly expanding my knowledge horizons. An insatiable learning enthusiast, I actively seek out new challenges and opportunities for growth. Additionally, I write blogs where I share my insights on various programming and deep learning concepts.


