Introduction
Are you passionate about the empirical investigation to find resilient solutions by answering some tough questions with data? Then this article is drafted for you. In this article, I am using a self-service analytics tool to visualize and explore data in cloud service. Yes, it is all about Power BI and Azure SQL Database.
If you have some data and you need to have interactive exploration of it, it is possible directly over the Azure database you have. Moreover, the visualization of the data can be obtained similarly.
Create an Azure SQL Database with sample data
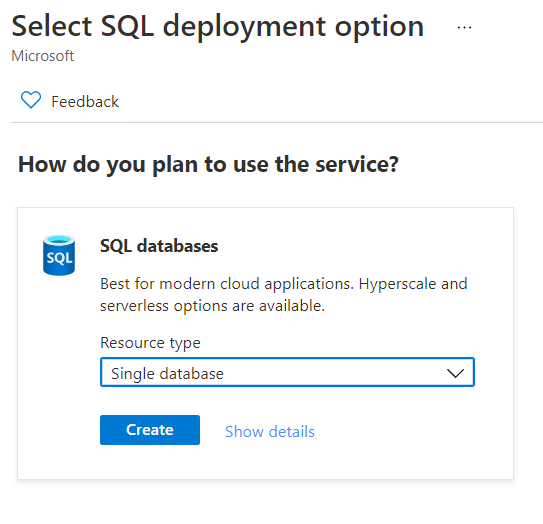
The first and foremost thing is you should have the database from where you can get the data to create insights. To create an Azure database, go to MS Azure Home and click on “create a resource”. An active Azure subscription is a prerequisite for creating an Azure SQL database. After creating a free account you can create the database following the instructions in official Azure SQL documentation.

After that, select your database and select “Query editor (preview)” from the page of your database.
I would like to design and develop an interactive map using Power BI. I assume I am getting data from various organizations in my dataset, where they can submit geographical data of their location. They have to answer some questions with a score rating of 1 to 10, which creates some quantitative data from where I am going to create regional maps.
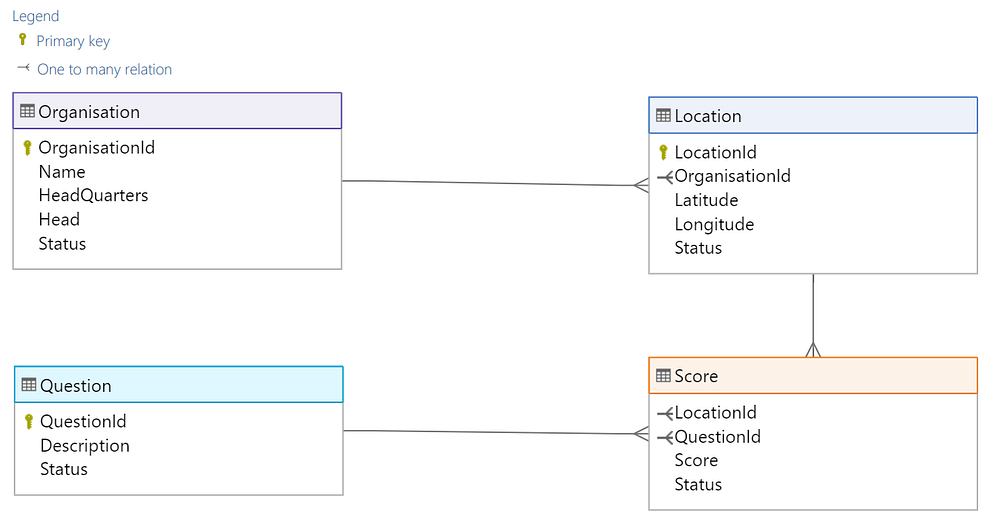
I created a sample schema for the above scenario as given below:

Database schema of the sample project
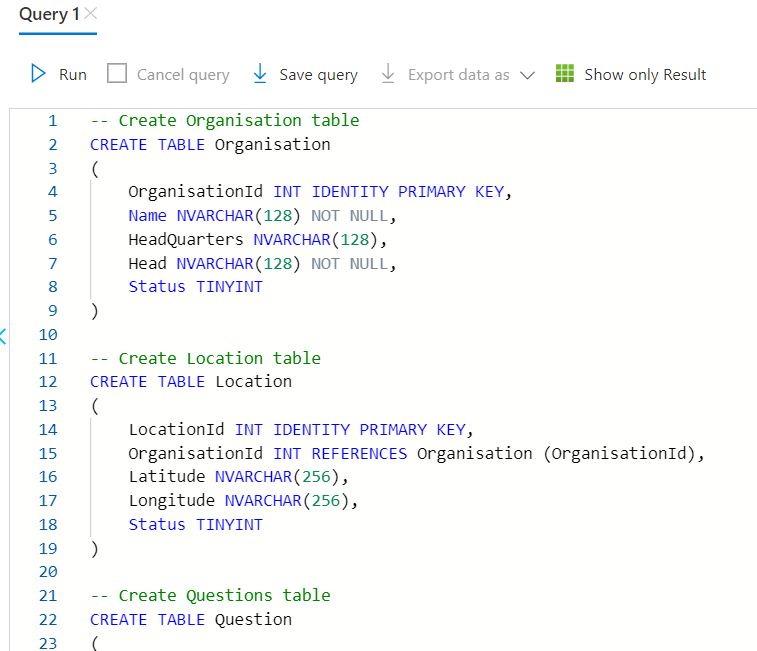
For interacting with relational databases, an extension of SQL, which is called T-SQL (Transact-SQL) (Microsoft’s and Sybase’s extension with ownership) can be used as query language as depicted in the below image.

sample T-SQL query
The T-SQL code that I used for creating the tables is given below:
--Create Organisation table
CREATE TABLE Organisation
(
OrganisationId INT IDENTITY PRIMARY KEY,
Name NVARCHAR(128) NOT NULL,
HeadQuarters NVARCHAR(128),
Head NVARCHAR(128) NOT NULL,
Status TINYINT
)
--Create Location table
CREATE TABLE Location
(
LocationId INT IDENTITY PRIMARY KEY,
OrganisationId INT REFERENCES Organisation (OrganisationId),
Latitude NVARCHAR(256),
Longitude NVARCHAR(256),
Status TINYINT
)
--Create Questions table
CREATE TABLE Question
(
QuestionId INT IDENTITY PRIMARY KEY,
Description NVARCHAR(256) NOT NULL,
Status TINYINT
)
--Create Score table
CREATE TABLE Score
(
LocationId INT REFERENCES Location (LocationId),
QuestionId INT REFERENCES Question (QuestionId),
Score DECIMAL(5,2) CHECK (Score <= 5.00),
Status TINYINT
)
The next step is adding data…
If you want to be familiar with querying (select, insert, drop, etc..) your Azure SQL database, you can follow the steps here. Now I am going to load data from a CSV into Azure SQL Database.
I used some data from GLOBAL PEACE INDEX 2020 to fill the questions table with some samples. I have chosen the top 25 peaceful countries and least peaceful countries in the Militarisation domain and Ongoing Domestic and International Conflict domain. The sample data that I have extracted from GPI Domain Scores for this project is available in my GitHub repository.
Create a storage account and load the CSV file into a container in Azure Storage Account. After uploading the files, create a shared access signature. Then click on Generate SAS token and URL. Then copy the Blob SAS token and go back to the Azure SQL database. I am utilizing database scoped credentials here for accessing my Azure blob storage as shown below screenshot.

screenshot: blob container
-- Create a database master key using your own password if it is not already defined only.
-- It is utilized for encrypting the credential secret in subsequent step. Otherwise skip this step
CREATE MASTER KEY ENCRYPTION BY PASSWORD = 'YourStrong!Password' ;
-- Creating database scoped credential.
CREATE DATABASE SCOPED CREDENTIAL MyAzureBlobStorageCredential
WITH
IDENTITY = 'SHARED ACCESS SIGNATURE' ,
SECRET = 'paste copied Blob SAS token here';
-- Create an external data source with CREDENTIAL option.
-- Go to container properties and copy the location url
CREATE EXTERNAL DATA SOURCE MyAzureBlobStorage
WITH
( LOCATION = 'https://xxxxxxx.blob.core.windows.net/project1948' ,
CREDENTIAL = MyAzureBlobStorageCredential ,
TYPE = BLOB_STORAGE
) ;
If the query is successful, you can execute the following steps to load the data into the specified table.
BULK INSERT [dbo].[Question] FROM 'question.csv'
WITH (
    CHECK_CONSTRAINTS,
    DATA_SOURCE = 'MyAzureBlobStorage',
    DATAFILETYPE='char',
    FIELDTERMINATOR=',',
    ROWTERMINATOR='0x0a',
    FIRSTROW=1,
    KEEPIDENTITY,
    TABLOCK
);
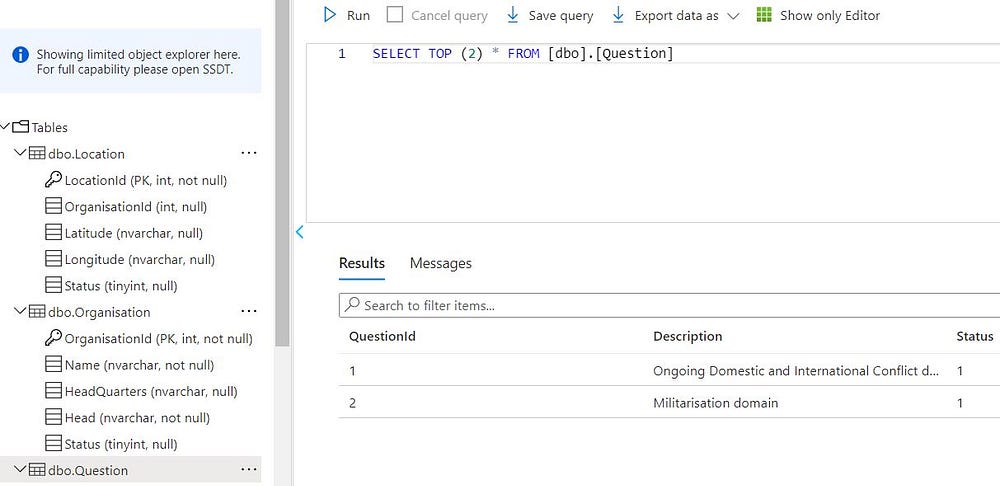
After, executing the bulk insert query, you can check whether the data is loaded properly.

Screenshot: Data loaded to Question table
Click on POWER BI (preview) on left side panel. Then open the pbids file of your project (It will be downloaded automatically when you click on POWER BI (preview)). Alternatively, you can open POWER BI Desktop and click on get from another source and select Azure SQL Database and perform necessary steps to get data as shown in below figure. If you are not familiar with Power BI , you can check my article which is targeted for beginners here.
The media shown in this article are not owned by Analytics Vidhya and is used at the Author’s discretion.


