This series of articles will enlighten you about different forecasting methods in the pharmaceutical industry. In the first part of the series, we will explore the forecasting method widely used in the pharmaceutical industry for new launch products. Forecasting can make or break a company. Therefore all pharma companies perform the forecasting exercise to have an idea of how their drug is going to perform in the market.
This article was published as a part of the Data Science Blogathon
We can divide pharma forecasting into two parts:
New Product Forecasting – Before launching a new product in the market companies make forecasts about their drug to have an idea how it is going to fare in the market.
In-Market Product Forecasting – Companies also make a demand or sales forecasts about their drugs that are already in the market. This is usually done with the help of historical sales and patient trends.
In this article, we will focus mainly on new product forecasting. We will discuss In-Market product forecasting in the next article
New Product Forecasting – Patient Based
We will specifically discuss patient-based new product forecasting. In this approach, our primary objective is to derive the number of potential patients for our drug. We will use a series of filters to achieve this.
Below we will formulate the approach for the same.
But first of all, we need to find the target patient population for our drug. Below are the steps where we will calculate potential target patients.
- Gather Population Data and prevalence rate of the disease.
- Calculate Prevalent Population = Total Population * Prevalence Rate
- Gather diagnosis rate (among the prevalent population) and calculate diagnosed population using formula = Prevalent Population*diagnosis rate
- We can now calculate the potential patients using treatment rate and the output which we received in the previous step: Diagnosed population * drug treatment rate

Refer to the below snapshot. We can calculate the patient numbers as below where we have population data, prevalence, diagnosis, and treatment rate and we translated all the data into the potential population.

However, we have just given a basic overview of how to calculate target patients. You can apply multiple other filters, such as symptomatic rate, which indicates how many patients exhibit symptoms, and access rate, which shows how many patients can afford healthcare. If you gather this information, you can include it.
Patient Segmentation: There are scenarios where forecasters divide the population into meaningful segments. For example, if dosages are different for the adult and pediatric population we can divide the potential patients into adult patients and pediatric patients and subsequently perform the rest of the calculation.
Concomitancy and Comorbidity in Forecasting
When a patient uses multiple drugs for the same disease state then it is called concomitancy.
When a patient uses a single drug for multiple disease states then it is called comorbidity.
Refer to the Venn diagram below, which shows the state of comorbidity. If a drug treats both disease A and disease B, the combined potential market for that drug is 33,000 patients (20,000 + 15,000 – 2,000 = 33,000).

Concomitancy will affect the market directly because it will increase the potential patient (by increasing drug usage) for the drug in the market. Let us take an example to understand this. If there are 100 patients in a market where 30 patients are taking two drugs. If our drug can be used for two indications then potential drug use is 130 instead of 100. Therefore, we can say that concomitancy inflates drug usage and hence increase the market size.
Patient Share Calculation Methodology
There are different methodology of calculating patient share.
User Entry Share method
It is the simplest method of share projection. We can enter projected shares for all drugs on a monthly, quarterly, or yearly basis. It is not much used as the logic behind defining project share is not transparent.
Peak share and time to peak share method
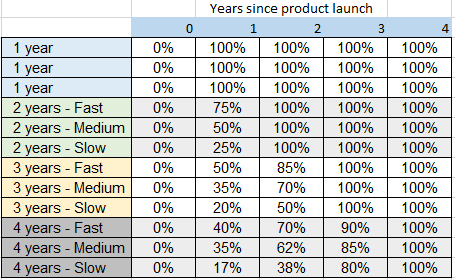
This is slightly complex than the user entry share method. In this method, the user needs to enter the expected peak share of the product and the time required to achieve the peak. However, the logic behind defining peak project share and time to peak is still not transparent in this method. Still, this method is widely used in the industry.
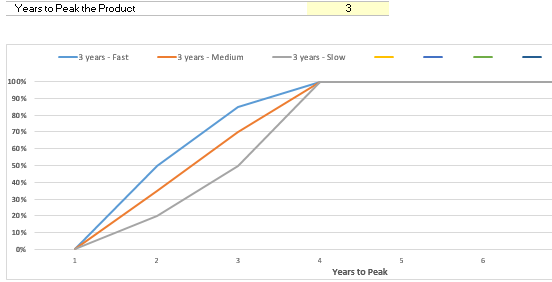
For example, if we assume that our product will peak in three years then there are three possibilities of achieving peak share in those three years. In the case of fast growth, it will achieve 50% market share in the first year of launch, and in the case of slow growth, it will achieve just 20% in the first year but will pick the growth in subsequent years.
Converting Patient Numbers to Revenue
Once we have calculated the number of potential patients our next step is to translate a patient number into volume and then into revenues. I am not considering compliance and prescribed days here for simplicity, but you can use them for a more sophisticated model.
Let us assume that our drug will be administered through a vial. Then we can use the below formula for conversion:
Total Number of Vials = Total vial utilization(per month)*Total number of treated Patients
An important point to note here is that we assume all our patients are paid patients, and this data excludes clinical trial patients and FOC patients (free of charge).
Also, we are not looking for parallel trade here which is common in the EU market.
Now we will convert volume into Gross Revenue with the below formula
Gross Sales = Total Number of Vials*List Price of Vial
Again for simplicity, we are not taking rebates or commercial discounts into account. But one can include them in their model to calculate net sales from the gross sales.
Now in order to forecast the sales in subsequent years, we can apply time series forecasting on the patient level. However general practice is to take the mean of 2-3 years in order to forecast patient numbers.
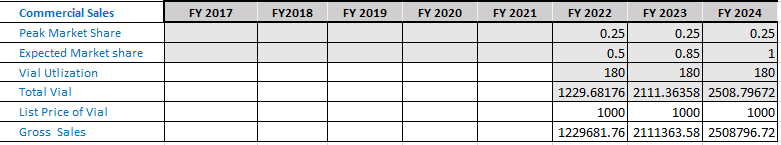
If you observe the below snapshot we are expecting a peak market share of 25% i.e. we are confident that we will capture 25% of the existing market within 3 years of the launch of the product. Using the calculation chart given in the previous section for time to the peak we can check that in the first year our product will grab 50% of the expected peak share, then 85% and 100% peak share in the third year. We have entered the same calculation in the “Expected Market Share” row.
Finally, we know our product utilization is 15 vials per month that translated to 180 vials per year and then we calculated the total vial using formula = Total potential patients*Peak Market Share*Expected Market share*Vial utilization
and Gross sales = Total Vial * List Price of Vial
Since we expect our product to launch in FY2022, the forecast calculates for FY2022-FY2024; hence, the FY2017-FY2021 columns are blank.
Conclusion
In this article, we explored patient-based forecasting for new drug launches, covering key steps like identifying target populations, segmentation, concomitancy, and revenue projection. Accurate forecasting is crucial for pharma companies to anticipate market demand. In the next article, we’ll discuss in-market forecasting and challenges in forecasting products with limited raw material supply. Stay tuned!
Analytics Vidhya does not own the media shown in this article on Forecasting in the Pharmaceutical Industry, and the author uses it at their discretion.


Thank you. This is really helpful. Can you suggest any book to website(with real life examples) . I would like to read more about this topic .
This is awesome. Can you also share some case studies or examples with templates