This article was published as a part of the Data Science Blogathon.
The internet contains vast amounts of information. Often, we need to access information fast and quickly. So for that, we need to use web scraping.
What is Web Scraping?
Web Scraping deals with collecting web data and information in an automated manner. Basically, it is the extraction of web data. Web Scraping deals with information retrieval, newsgathering, web monitoring, competitive marketing and more. The use of web scraping makes accessing the vast amount of information online, easy and simple. It is a lot faster and simpler than manually extracting data from websites. Web Scraping is becoming more popular these days. An online data scraping script can make a lot of data gathering and information extraction easy and simple.
( Images: https://www.pexels.com/photo/gray-laptop-computer-showing-html-codes-in-shallow-focus-photography-160107/)
Applications of Web Scraping
Web scraping has a lot of uses, in reputation monitoring, data analysis, lead generation, research, and so on.
1. There is a huge demand for web scraping in the financial world. Text analysis tools extract data from business and economics news articles, and these insights are used by Bankers and Analysts to drive investment strategies. Tweets influence stocks and the overall stock market a lot. Information regarding that can be scraped from Twitter. Similarly, financial analysts can scrape financial data from public platforms like Yahoo finance and so on. All these methods are very helpful in the financial world where quick access to data can make or break profits.
2. E-Commerce websites use web scraping to understand pricing strategies and see what prices are set by their competitors. Analysts and Market Research teams use data from web scraping to drive the pricing models. This application is known as price intelligence. The data scraped, can be used to make better pricing decisions. It can be done through revenue optimization, competitor monitoring, price trend analysis, and so on.
3. Market research is also very important, and the data scraped can be used to optimize the offerings and product delivery strategy of a company. Also, the data can be used for various research and development purposes.
4. Text analytics of reviews and customer comments also helps E-Commerce websites in driving their strategy and methods. Such data can also help in planning the brand strategy of companies.
5. Now, the application we will be implementing is Content and News monitoring and sentiment analysis. News websites and content are scraped to understand the general sentiment, opinion, and general happenings.
We will take an article focusing on Space exploration news and first start with getting the text data from the website.
Getting Started with the Code
First, we start by importing the necessary libraries.
#Importing the essential libraries
#Beautiful Soup is a Python library for pulling data out of HTML and XML files
#The Natural Language Toolkit
import requests
import nltk
from bs4 import BeautifulSoup
import numpy as np
import pandas as pd
import seaborn as sns
import matplotlib.pyplot as plt
%matplotlib inline
import random
from wordcloud import WordCloud
import os
import spacy
nlp = spacy.load('en_core_web_sm')
from textblob import TextBlob
from pattern.en import sentiment
So, we have all the necessary libraries.
Now, we create a request and get the data from the website.
#we are using request package to make a GET request for the website, which means we're getting data from it.
r=requests.get('https://www.newsy.com/stories/commercial-companies-advance-space-exploration/')
Now, we set the correct text encoding.
#Setting the correct text encoding of the HTML page
r.encoding = 'utf-8'
Now, we get the HTML from the request object.
#Extracting the HTML from the request object
html = r.text
Let us see how the HTML looks like. Let us take 500 characters from the HTML.
# Printing the first 500 characters in html
print(html[:500])
Output:
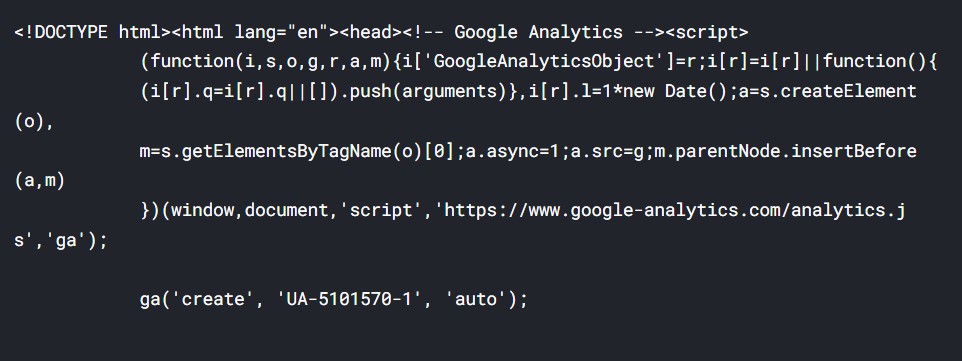
Now, we create a beautiful soup object from the HTML.
# Creating a BeautifulSoup object from the HTML
soup = BeautifulSoup(html)
# Getting the text out of the soup
text = soup.get_text()
Let us have a look at the length of the text.
#total length
len(text)
Output:
4097
So, the text has over 4000 characters.
Let us have a look at the text.
#having a look at the text
print(text[100:1100])
Output:
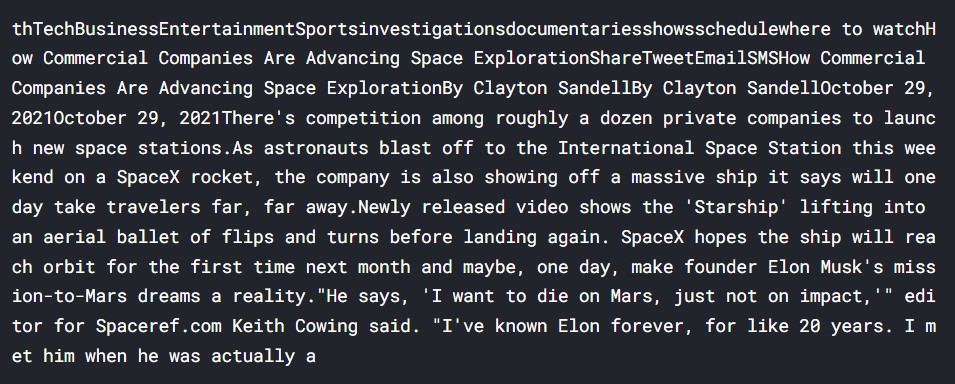
So, the text is extracted successfully. We can now work with the text and process it.
Let us now proceed with text cleaning.
clean_text= text.replace("n", " ")
clean_text= clean_text.replace("/", " ")
clean_text= ''.join([c for c in clean_text if c != "'"])
Now, after cleaning, let us have a look at the text.
clean_text
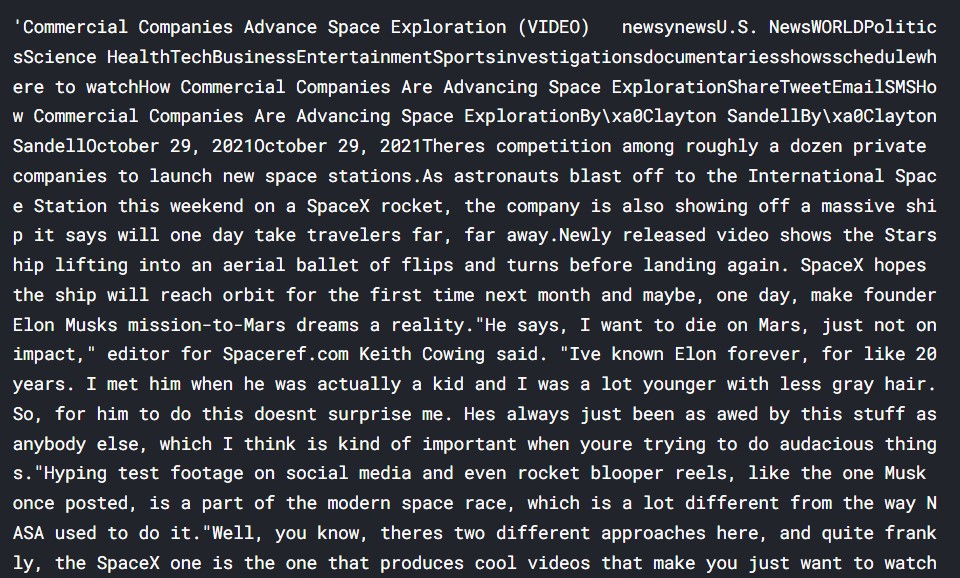
The text does look better, a lot of non-essential stuff was removed earlier.
Now, we split the text into individual sentences.
sentence=[]
tokens = nlp(clean_text)
for sent in tokens.sents:
    sentence.append((sent.text.strip()))
Let us see how they look.
sentence
Output:
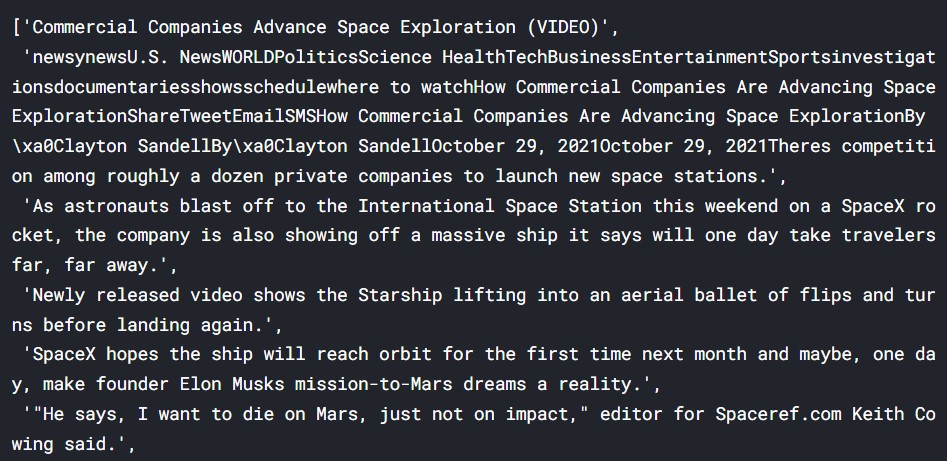
How many sentences are there in the data?
print(len(sentence))
Output:
33
Let us have a look at the 3rd sentence.
print(sentence[2])
Output:

Now, that we have the data as sentences, let us proceed with sentiment analysis.
Sentiment analysis is an application of data via which we can understand the nature and tone of a certain text.
Sentiment Analysis with Textblob
Textblob is a Python library for text processing and NLP. Textblob has built-in functions for performing sentiment analysis. The function returns a score for polarity and subjectivity.
Polarity score can be positive or negative, and Subjectivity varies between 0 and 1.
Let us create an empty list and get all the data.
textblob_sentiment=[]
for s in sentence:
    txt= TextBlob(s)
    a= txt.sentiment.polarity
    b= txt.sentiment.subjectivity
    textblob_sentiment.append([s,a,b])
We created an empty list, and all the data successfully go into the lists. Now, we convert this list to a data frame. Making it into a data frame makes analyzing and plotting easier.
df_textblob = pd.DataFrame(textblob_sentiment, columns =['Sentence', 'Polarity', 'Subjectivity'])
Let us now have a look at the data frame.
df_textblob.head()
Output:

The sentences and their sentiment scores have been formatted into a data frame.
df_textblob.info()
Output:
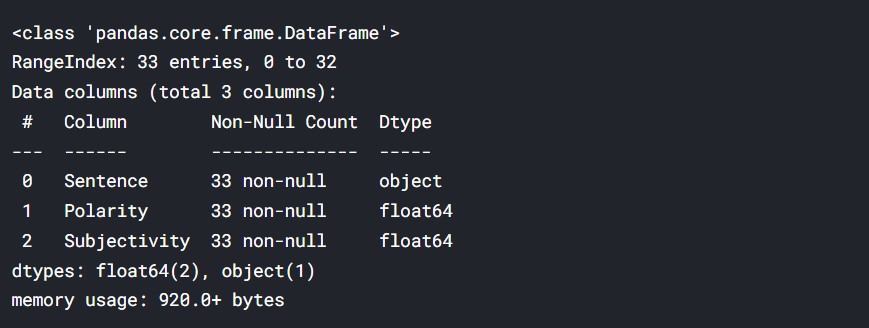
The data frame contains the 33 sentences and their Polarity and Subjectivity scores.
Let us first analyse the sentence polarity.
sns.displot(df_textblob["Polarity"], height= 5, aspect=1.8)
plt.xlabel("Sentence Polarity (Textblob)")
Output:
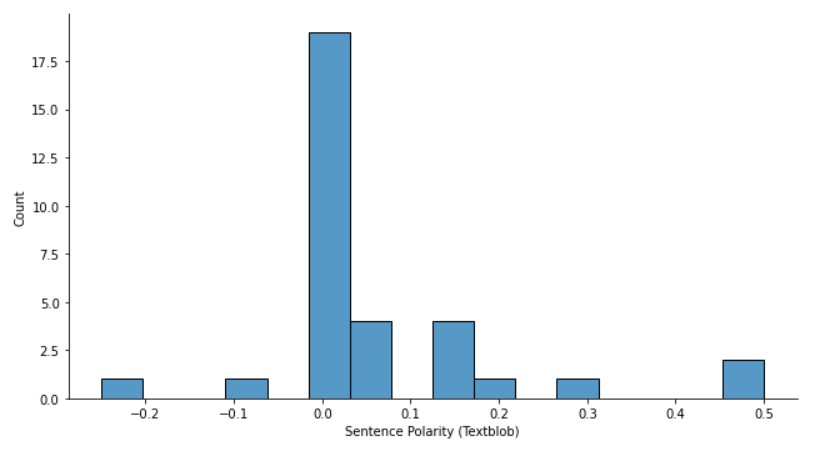
Due to some reason around half the sentences have zero polarity. Maybe, it’s because of the fact that they are neutral. A few sentences are highly positive and a few are negative.
Now, let us have a look at subjectivity.
sns.displot(df_textblob["Subjectivity"], height= 5, aspect=1.8)
plt.xlabel("Sentence Subjectivity (Textblob)")
Output:
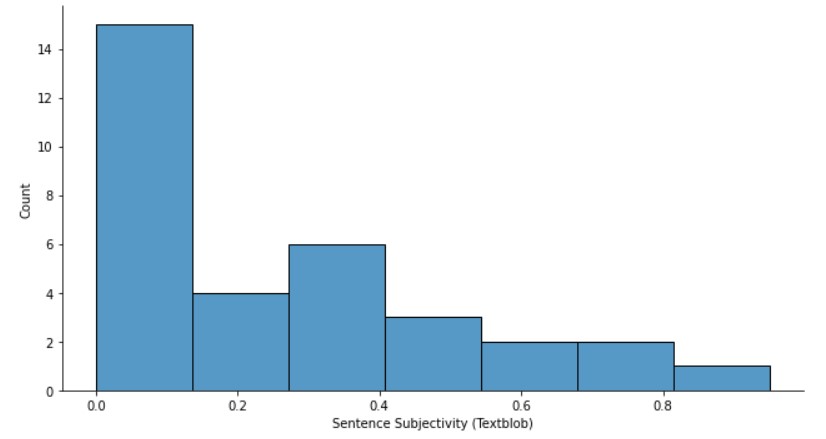
The values of subjectivity also vary, with few sentences being highly subjective and a majority of sentences being less subjective.
Now, let us use a different library for sentiment analysis.
Sentiment Analysis with Pattern
Pattern is also a very useful NLP and text processing library in Python. Pattern has functions to perform sentiment analysis of a text. The good part of pattern is that it is open source. Pattern has the function which can understand the opinions and sentiment of a text, let us implement it in Python.
First, we take the sentences and get the sentiment scores.
pattern_sentiment=[]
for s in sentence:
    res= sentiment(s)
    c= res[0]
    d= res[1]
    pattern_sentiment.append([s,c,d])
Let us see, how a single data point looks like now.
pattern_sentiment[1]
Output:

Now, we convert the data into a data frame.
df_pattern = pd.DataFrame(textblob_sentiment, columns =['Sentence', 'Polarity', 'Subjectivity'])
df_pattern.head()
Output:

So, the data has been formed into a data frame.
Let us see how the data looks like.
df_pattern.info()
Output:
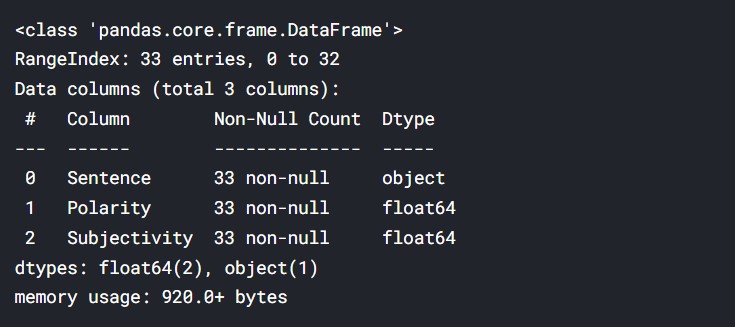
So, there are 33 sentences and their sentence scores.
Now, we plot the scores.
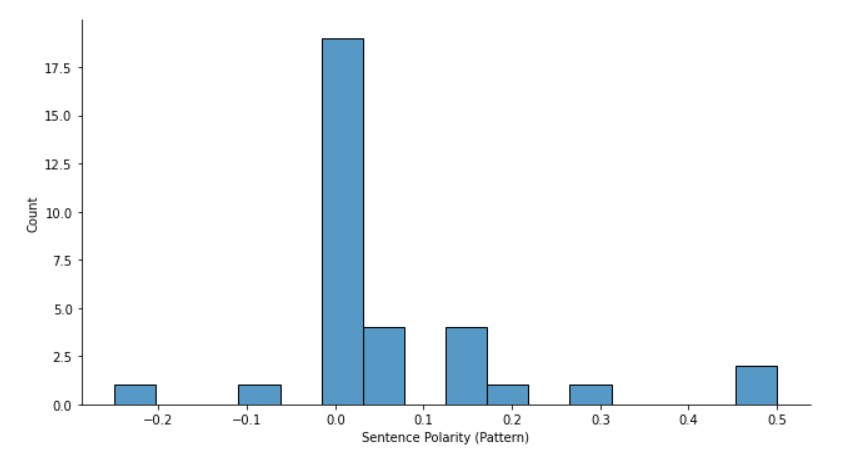
sns.displot(df_pattern["Polarity"], height= 5, aspect=1.8)
plt.xlabel("Sentence Polarity (Pattern)")
Output:
sns.displot(df_pattern["Subjectivity"], height= 5, aspect=1.8)
plt.xlabel("Sentence Subjectivity (Pattern)")
Output:
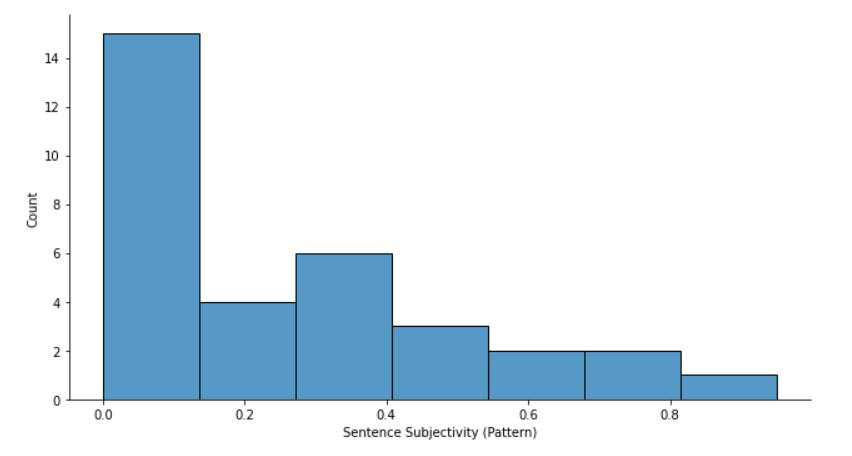
Here, also a similar data distribution can be seen.
Word Frequency and Word Cloud
A good way to understand the overall opinions and ideas in the text is by analyzing the word frequency and making a word cloud. They are great ways to visualize the sentiment expressed by an article or a blog.
We start by creating the NLTK tokenizer, the tokenizer will convert the text into individual tokens.
#Creating the tokenizer
tokenizer = nltk.tokenize.RegexpTokenizer('w+')
Now, we will perform the tokenization.
#Tokenizing the text
tokens = tokenizer.tokenize(clean_text)
Let us see how many tokens we have.
len(tokens)
Output:
647
Let us now have a look at the tokens.
print(tokens[0:10])
Output:

Now, we convert them to lower case for uniformity.
words = []
# Looping through the tokens and make them lower case
for word in tokens:
    words.append(word.lower())
Now, we need to remove the stopwords.
#Now we have to remove stopwords
#Stop words are a set of commonly used words in any language.
#For example, in English, “the”, “is” and “and”, would easily qualify as stop words.
#In NLP and text mining applications, stop words are used to eliminate unimportant words,
#allowing applications to focus on the important words instead.
#English stop words from nltk
stopwords = nltk.corpus.stopwords.words('english')
#Appending to words_new all words that are in words but not in sw
for word in words:
    if word not in stopwords:
        words_new.append(word)
With this, the stopwords have been removed. Let us check the length of the text.
len(words_new)
Output:
400
Let us have a look at the words now, which are now converted into lower case, and stopwords have been removed.
print(words_new[0:10])
Output:

Now, we get the frequency distribution of the words.
#The frequency distribution of the words
freq_dist = nltk.FreqDist(words_new)
Now, we plot the data.
#Frequency Distribution Plot
plt.subplots(figsize=(16,10))
freq_dist.plot(20)
Output:
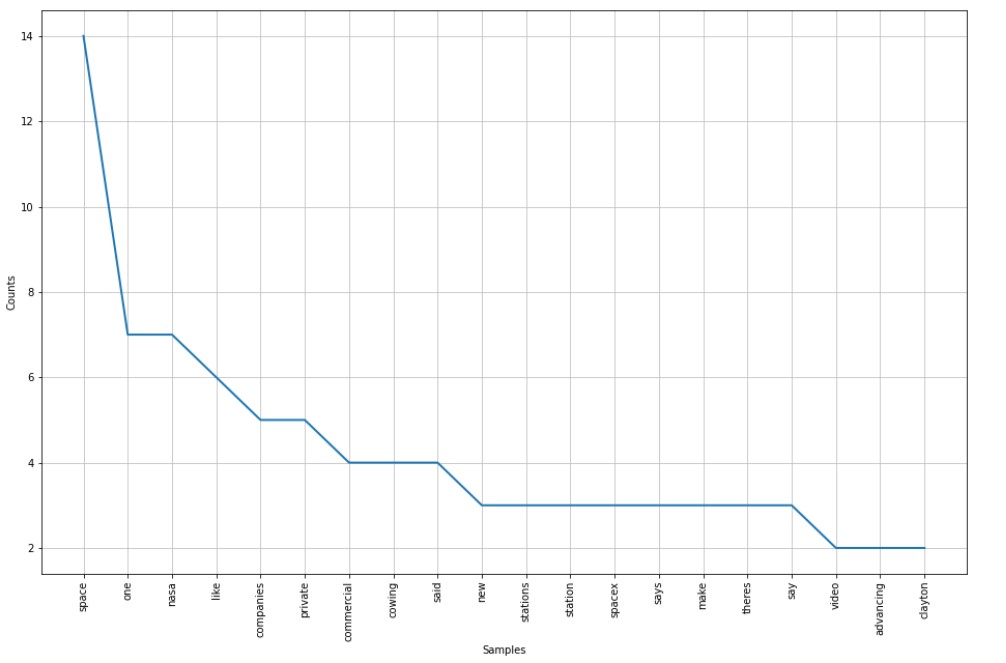
We see that space, NASA, SpaceX, etc can be seen. All these are related to space exploration and space travel.
#converting into string
res=' '.join([i for i in words_new if not i.isdigit()])
Now, we plot a word cloud with these text words.
plt.subplots(figsize=(16,10))
wordcloud = WordCloud(
                          background_color='black',
                          max_words=100,
                          width=1400,
                          height=1200
                         ).generate(res)
plt.imshow(wordcloud)
plt.title('NEWS ARTICLE (100 words)')
plt.axis('off')
plt.show()
Output:
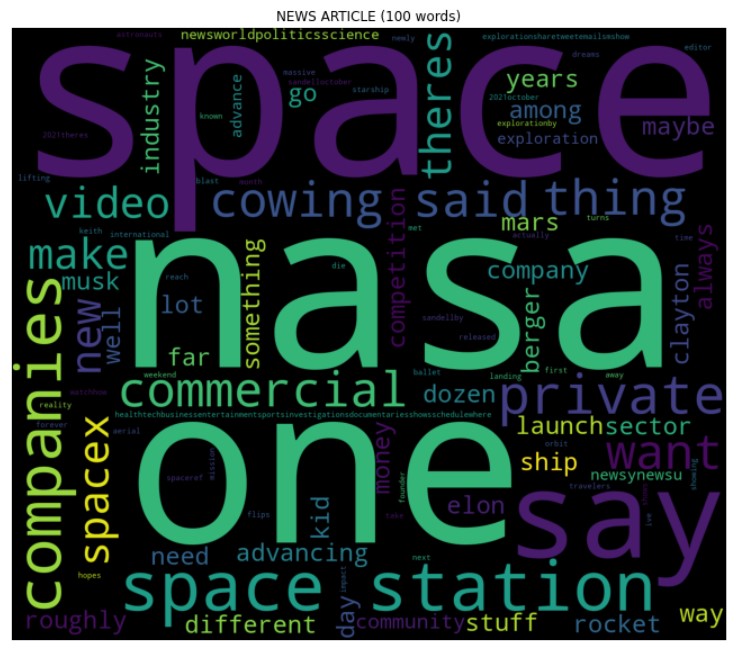
So, the word cloud is plotted and we see various stuff related to space exploration and space travel.
Conclusion
So, using Web Scraping, we are able to gather information from a website and use the text data for sentiment analysis. The whole process is simple and easy. Web scraping and NLP have many applications. The vast amount of text data at our disposal is so large, that the potential is immense. With proper methods, these data can be used to make data-driven decisions.
All the code is present in a Kaggle Notebook, I am sharing the link to the notebook.
Link: https://www.kaggle.com/prateekmaj21/web-scraping-a-news-article-and-sentiment-analysis
About me
Prateek Majumder
Analytics | Content Creation
Connect with me on Linkedin.
My other articles on Analytics Vidhya: Link.
Thank You.
The media shown in this article is not owned by Analytics Vidhya and are used at the Author’s discretion


