This article was published as a part of the Data Science Blogathon.
Introduction
For data scientists and machine learning engineers, developing and testing machine learning models may take a lot of time. For instance, you would need to write a few lines of code, wait for each model to run, and then go on to the following five models to train and test. This may be rather tedious. However, when I encountered a similar issue, I became so frustrated that I began to devise a way to make things simpler for myself. After four months of hard work – coding, and bug-fixing, I’m happy to share my solution with you.
MultiTrain is a Python module I created that allows you to train many machine learning models on the same dataset to analyze performance and choose the best models. The content of this article will show you how to utilize MultiTrain for a basic regression problem. Please visit here to learn how to use it for classification problems.
Now, code alongside me as we simplify the model training and testing of machine learning models with MultiTrain.
Importing Libraries and Dataset
Today, we will be testing which machine learning model would work best for the productivity prediction of garment employees. The dataset is available here on Kaggle for download.
To start working on our dataset, we need to import some libraries.
To import our dataset, you must ensure it is in the same path as your ipynb file, or else you will have to set a file path.
Python Code:
import pandas as pd
from sklearn.preprocessing import LabelEncoder
df = pd.read_csv('garments_worker_productivity.csv')
print(df.head())
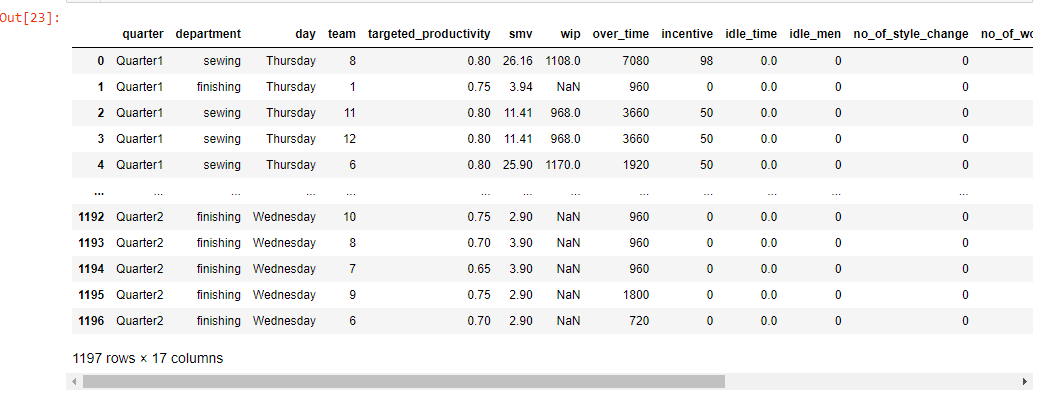
Now that we have imported our dataset into our Jupyter notebook, we want to see the first five rows of the dataset. You need to use a single line of code for that.

Note: Not all columns are shown here; only a few we would be working with are present in this snapshot except the output column.
Data Preprocessing
We wouldn’t be employing any primary data preprocessing techniques or EDA as our focus is on how to train and test lots of models at once using the MultiTrain library. I strongly encourage you to perform some major preprocessing techniques on your dataset, as dirty data can affect your model’s predictions. It also affects the performance of machine learning algorithms.
While you check the first five rows, you should find a column named “department”, in which sewing is spelt as sweing. We can fix this spelling mistake with this line of code.
df["department"] = df["department"].str.replace('sweing', 'sewing')

We can see in this snapshot above that the spelling mistake is now corrected.
When you run the following lines of code, you will discover that the “department” column has some duplicate values that we have to take care of, and we will also need to fix that before we can start predicting.
print(f'Unique Values in Department before cleaning: {df.department.unique()}')
Output:
Unique Values in Department before cleaning: ['sewing' 'finishing ' 'finishing']
To fix this problem:
df['department'] = df.department.str.strip()
print(f'Unique Values in Department after cleaning: {df.department.unique()}')
Output:
Unique Values in Department before cleaning: ['sewing', 'finishing']
Let’s replace all missing values in our dataset with an integer value of 0
for i in df.columns:
    if df[i].isnull().sum() != 0:
        df[i] = df[i].fillna(0)
Most scikit-learn algorithms can’t handle categorical data, so we need to convert the columns with categorical data to numerical with label encoding. There are several other methods of encoding categorical data, e.g. ordinal encoding, target encoding, binary encoding, frequency encoding, mean encoding, and others. The listed methods have advantages and disadvantages, and it’s advisable to test as many as possible to see which works best for your dataset in terms of performance.
As I mentioned previously, we would use a label encoder for this tutorial to encode our categorical columns. Firstly, we have to get a list of our categorical columns. We can do that using the following lines of code.
cat_col = []
num_col = []
for i in df.columns:
    if df[i].dtypes == object:
        cat_col.append(i)
    else:
        num_col.append(i)
#remove the target columns
num_col.remove('actual_productivity')
Now that we have gotten a list of our categorical columns inside the cat_col variable. We can now apply our label encoder to it to encode the categorical data into numerical data.
label = LabelEncoder()
    for i in cat_col:
        df[i] = label.fit_transform(df[i])

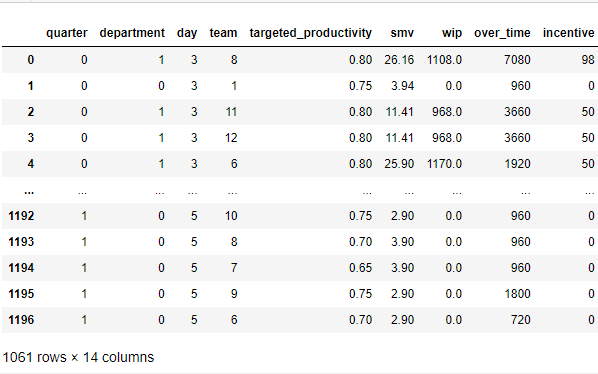
All missing values formerly indicated by NaN in column ‘wip’ has now changed to 0 and the three categorical columns – quarter, department, and day have all been label encoded.
You may still need to fix outliers in the dataset and do some feature engineering on your own.
Model Training
Before we can begin model training, we will need to split our dataset into its training features and labels.
features = df.drop('actual_productivity', axis=1)
labels = df['actual_productivity']
Now, we would need to split the dataset into training and tests. The training sets are used to train the machine learning algorithms and the test sets are used to evaluate their performance.
train = MultiRegressor(random_state=42,
                       cores=-1,
                       verbose=True)
split = train.split(X=features,
                    y=labels,
                    sizeOfTest=0.2,
                    randomState=42,
                    normalize='StandardScaler',
                    columns_to_scale=num_col,
                    shuffle=True)
The normalize parameter in the split method allows you to scale your numerical columns by just passing in any scalers of your choice; the columns_to_scale parameter then receives a list of the columns you’d like to scale instead of having to scale all columns automatically.
After splitting the features and labels into train, test is appended to a variable named split. This variable then holds X_train, X_test, y_train, and y_test; we would need it in the next function below.
fit = train.fit(X=features,
                y=labels,
                splitting=True,
                split_data=split)

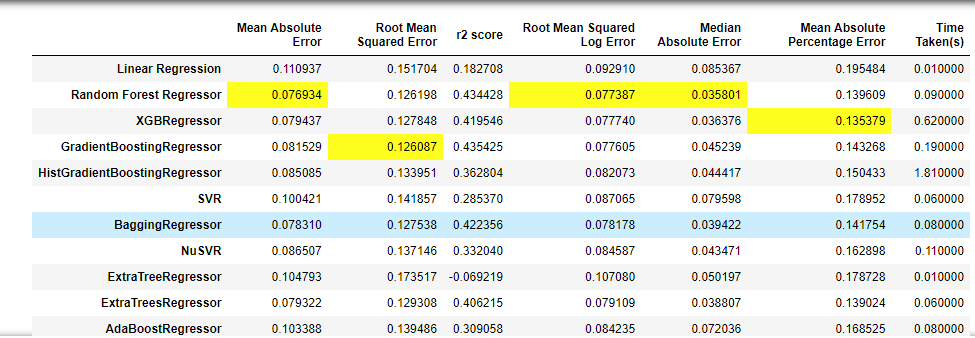
Run this code in your notebook to view the full model list and scores.
Visualize Model Results
For the sake of people who might prefer to view the model performance results in charts rather than a dataframe. There’s also an option available for you to convert the dataframe into charts. All you have to do is to run the code below.
train.show(param=fit,
           t_split=True)
Conclusion
MultiTrain exists to help data scientists and machine learning engineers make their job easy. It eliminates repetition and the boring process. With just a few lines of code, you can get your model training and testing immediately.
The assessment metrics shown on the dataframe might also differ based on the problem you’re attempting to solve, such as multiclass, binary, classification, regression, imbalanced datasets, or balanced datasets. You have even more freedom to work on these challenges by passing values to parameters in different methods rather than writing extensive lines of code.
After fitting the models, the results generated in the dataframe shouldn’t be your final results. Since MultiTrain aims to determine the best models that work best for your particular use case, you should pick the best models and perform some hyperparameter tuning on them or even feature engineering on your dataset to further boost the performance.
The media shown in this article is not owned by Analytics Vidhya and is used at the Author’s discretion.


This is amazing. I tagged along and the result was amazing. Good job Shittu.
Amazing stuff. Great job Shittu.
Amazing stuff. Great job Shittu.