This article was published as a part of the Data Science Blogathon.
Introduction
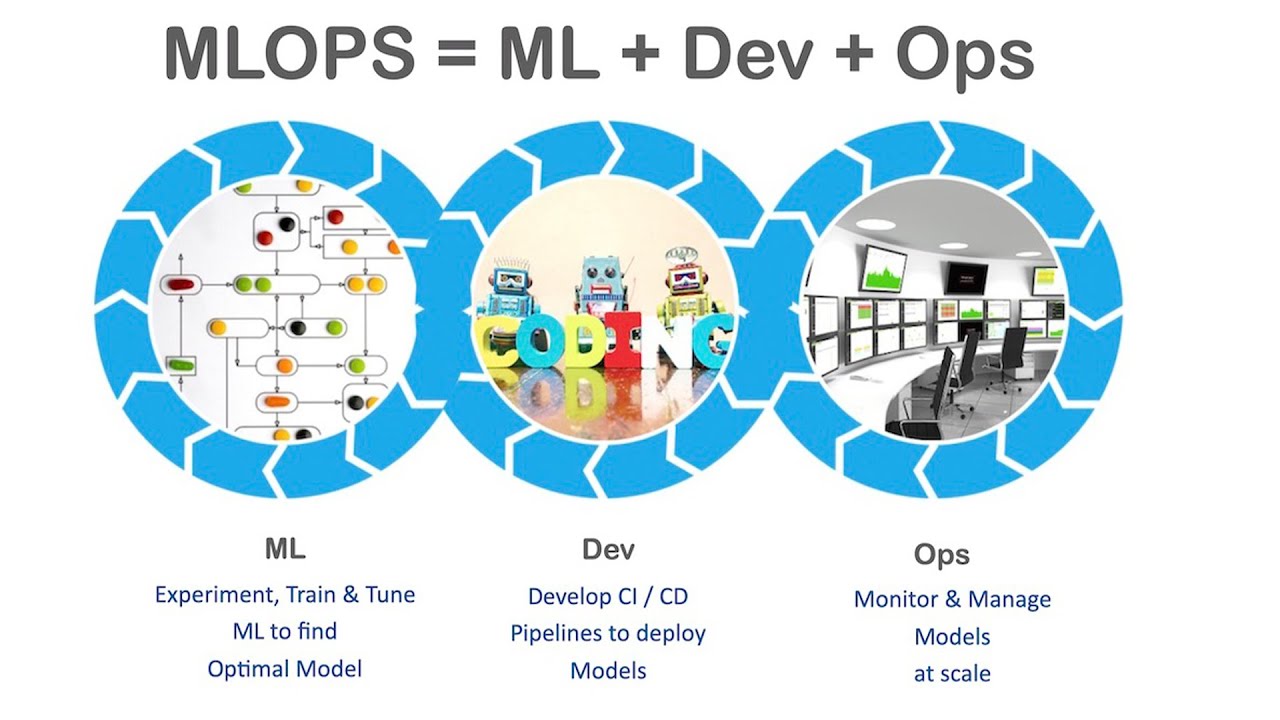
This article is part of blog series on Machine Learning Operations(MLOps).

Source: https://i.ytimg.com/vi/XoXvX8MyW8M/maxresdefault.jpg
Deploy MLOps Module
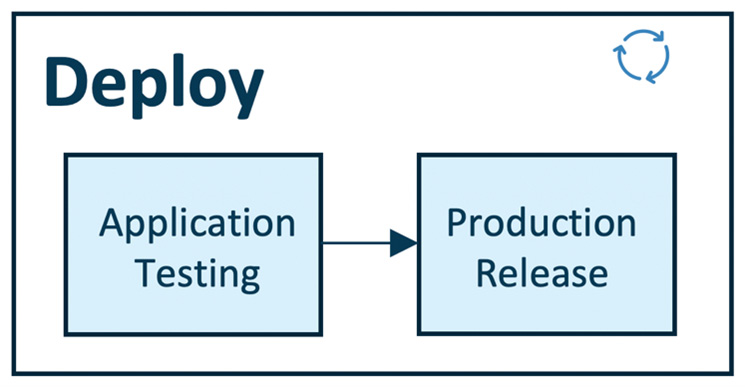
It enables operationalizing the ML models we developed in the previous module(Build). In this “deploy module”, we test our model performance in a production or production-like environment to ensure the robustness and scalability of the ML model for production use.

Source: https://encrypted-tbn0.gstatic.com/images?q=tbn:ANd9GcRCvPOWwfhMp6w77nsqY933PGtzZXV0OmXGoA&usqp=CAU
This module has two steps, application testing, and production release. The deployment pipeline is enabled by streamlined CI/CD pipelines connecting the development to the production environment.
What is ci/cd means?
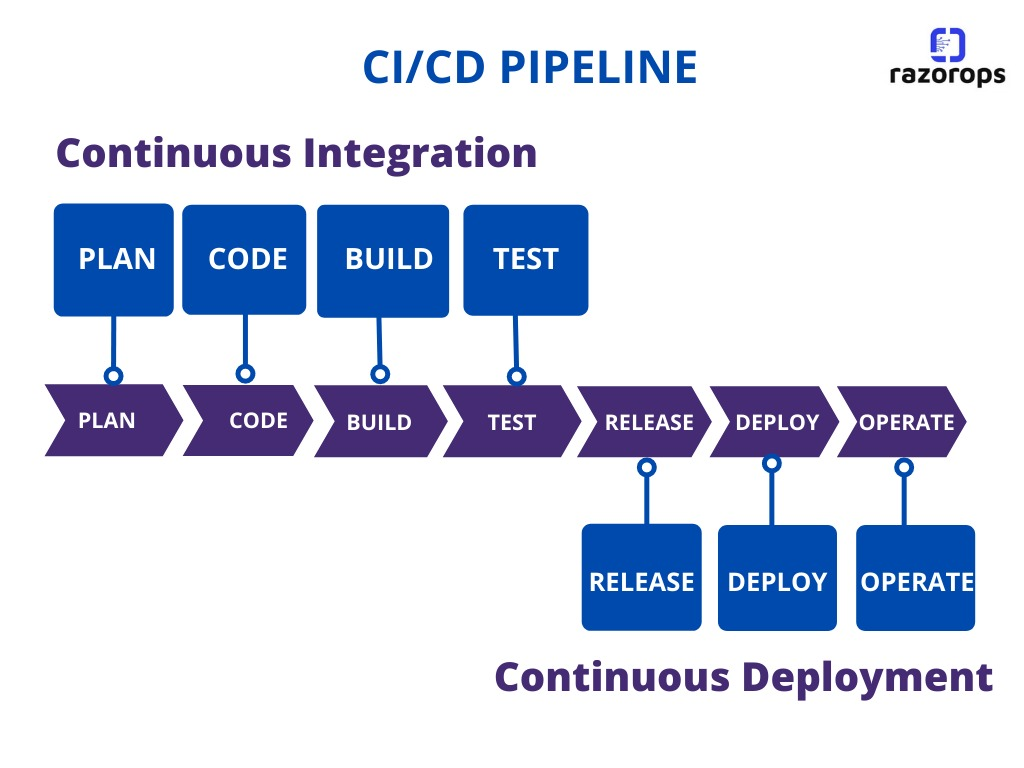
CI/CD pipeline
CI – Continuous Integration
CD – Continuous Delivery
Continuous integration is a development practice in which all the codes are stored in a central repository, continuously modified multiple times, and the product is integrated. Continuous Delivery is the practice of automating the product(software/application) release process. Thus, the application is modified and delivered automatically.

Source: https://razorops.com/images/blog/cici-pipeline-blog.png
Application Testing
In the previous phase, we registered the trained model. We have evaluated the trained model with test data. But as a whole application, we didn’t test it. It is vital to test the application for robustness and performance. Hence we have the “Application Testing” phase, which is tested in a production-like environment(Test Environment). It will resemble the production environment but not exactly the production environment.
The model is deployed as an API or streaming service in the test environment. After the model is deployed for testing, it will predict the target using test data(not used for training the model). Now in the test environment, the robustness and performance of the model are tested.
Quality assurance experts automatically or manually review the robustness and performance for good results. After the ML model’s performance meets the standards, it is approved to be deployed in the production environment. The model will be used in the production environment to infer real-time data to make business decisions.
Use case Implementation:
NOTE: In the previous article, we have taken a use case for understanding. If you don’t understand, please read the previous article.
In the previous article, we developed an Image classification service to classify cars and trucks in real-time from the CCTV camera. We registered our model and made it available for rapid deployment. Now in this phase, we will deploy the model as an API in the test environment. This test environment may be an on-premises computer near CCTV cameras. This computer will be connected to the CCTV camera to fetch the data from it to classify the cars and trucks. We will test the model’s performance, reliability, and scalability in this test environment. Mainly we will check the accuracy, errors, consistency, latency, etc of the model. It will be pushed to the next stage if it meets the standard. Otherwise, it will be optimized before pushing the application to production.
Production Release
Once the models are approved in the testing environment, they will be ready for deployment in the production environment. This will be enabled by CI/CD pipeline.

Use case Implementation:
In the previous module, we tested our model for accuracy, errors, consistency, and latency in the test environment. Now our classification model for classifying trucks and cars is deployed in production. This model will infer the incoming video data from CCTV cameras in the signals for classifying cars and trucks. in real-time.
Monitor the MLOps
The word monitor itself defines this module. In the previous modules, we built the model and deployed it in production. Our MLOPs process doesn’t end here. It will go further. In this monitor module, we monitor productized model, analyze the results, and govern the deployed ML models. In the monitoring stage,
- We monitor the performance of the ML models and applications
- Analyze the metrics and results
- Govern the ML applications and take necessary actions when needed
1) Monitor
This phase monitors information, model drift, and app performance. Sometimes, we have to monitor the device performance which is in production. The production device’s performance and health can be monitored with the help of telemetry data like temperature, pressure, magnetometer, etc.
In this phase, we monitor mainly data integrity, model drift, and application performance.
Usually, accuracy, F1 score, precision, and recall are monitored for the deployed API service on the computer connected to the CCTV cameras for classifying cars and trucks.
2) Analyze
Once we get the results, we need to analyze those results for further improvement. This phase is important as this will create a great impact on business decisions. We will calculate model fairness, trust, bias, transparency, and errors to improve the model performance.
Sometimes, our model may not perform well after a few days, weeks, or years. This happens because of the change in the properties of the dependent(target) variable. This change can make our model useless. So this change is called Model Drift. We have to analyze the failed results to get the new properties of the target variable.
Example: Consider a situation where we have made a recommendation system for Netflix. Our model will recommend some movies/series based on our previous history. Our model is trained based on that data. Now, after so many years, we are getting poor recommendations. Because our selection of movies, the genre, and other attributes may have changed during this period time, this was not given to the model. So the model is not capable of recommending appropriate films to the users. This is called Model Drift.
There are certain methods to handle this model drift.
We must analyze the model and take necessary action if this scenario happens in our use case.
3) Govern
After monitoring the models and analyzing the results, we have to generate alerts and take actions to govern the system.
Example: In some use cases, when the model’s performance doesn’t meet the standards, we have to give alerts to the concern team and department. In such cases, we can specify some threshold values for metrics like accuracy, precision, and recall. If the model performs below the threshold, we must generate alerts.
Use case Implementation:
As we have deployed the classification model in the production system. We have collected metrics like accuracy, precision, recall, etc. We can set a threshold for accuracy as 60%. When this accuracy goes below the specified threshold, we must set the system to give alerts and notifications. We will collect all the classification reports in a day. If the classification accuracy is less than 60% on that day, we have to give mail alerts to the ML team.
Then the ML team members can re-train the model with new data sets.
So, we have developed, trained, deployed, monitored, analyzed, and governed the models. This is the pipeline of MLOPS.
Conclusion
The difficulty faced by the ML team and DevOps team led to the formation of the streamlined pipeline of MLOps. This pipeline helped us to develop the model and push it to production without any hardships. In this article, we have explored the model deployment pipeline and seen a use case deploying for the car and truck classification model. The model deployment pipeline has two core modules: application testing and production release. After releasing the model, we also discussed the monitoring phase. This way, a smaller ML team can build a complex pipeline and manage it efficiently.
Key takeaway
- MLOps is the combination of ML, Development, and Operations.
- At the end of the day, we are not going to keep our model in the local system. We want to deploy it elsewhere where users worldwide can use it right from their place.
- The ML teams’ work doesn’t end if the model is deployed in the cloud. The next important phase is Monitoring them.
- While monitoring the performance, there may be a chance to change some features of the model or change the model itself if the performance is not good enough.
If you haven’t read the previous article, here is the link:
If you liked this article and want to know more, visit my other articles on Data Science and Machine Learning by clicking on the Link.
I hope you enjoyed the article and increased your knowledge. Please feel free to contact me at [email protected] Linkedin.
Read more articles on the blog.
The media shown in this article is not owned by Analytics Vidhya and is used at the Author’s discretion.


