This article was published as a part of the Data Science Blogathon.
Introduction
Job interviews in data science demand particular abilities. The candidates who succeed in landing employment are often not the ones with the best technical abilities but those who can pair such capabilities with interview acumen.
Even though the field of data science is diverse, a few particular questions are frequently asked in interviews. Consequently, I have compiled a list of the seven most typical data science interview questions and their responses. Now, let’s dive right in!
 Source: Glassdooor
Questions and Answers
Question 1: What assumptions are necessary for linear regression? What happens when some of these assumptions are violated?
A linear regression model is predicated on the following four assumptions:
Linearity: X and the mean of Y have a straight-line relationship.
Homoscedasticity: The variance of the residual is the same for every value of X.
Independence: Observations are mutually exclusive of one another.
Normality: Y is normally distributed for any fixed value of X.
Extreme deviations from these presumptions will render the results redundant. Smaller deviations from these presumptions will increase the estimate’s bias or variance.
Smaller deviations from these presumptions will increase the bias or variance of the estimate.
Question 2: What does collinearity mean? What is multicollinearity? How do you tackle it? Does it have an impact on decision trees?
Answer: Collinearity: A linear relationship between two predictors is called collinearity.
Multi-collinearity: Multi-collinearity refers to the relationship between two or more predictors in a regression model that is strongly linearly related.
This challenges because it undermines an independent variable’s statistical importance. While it may not always significantly affect the model’s accuracy, it affects the variance of the prediction. It lowers the quality of the interpretation of the independent variables.
Nonetheless, if you are only interested in making predictions, you don’t care if there is collinearity; however, to have a more interpretable model, you should avoid features with a very high (~R2 >.8) percentage of their content in the features. Alternatively, you can also use the Variance Inflation Factors (VIF) to check if collinearity/multi-collinearity is present between independent variables. A standard benchmark is if VIF is greater than 5, then multi-collinearity exists.
So, collinearity/multi-collinearity prevents us from understanding how each variable affects the outcomes.
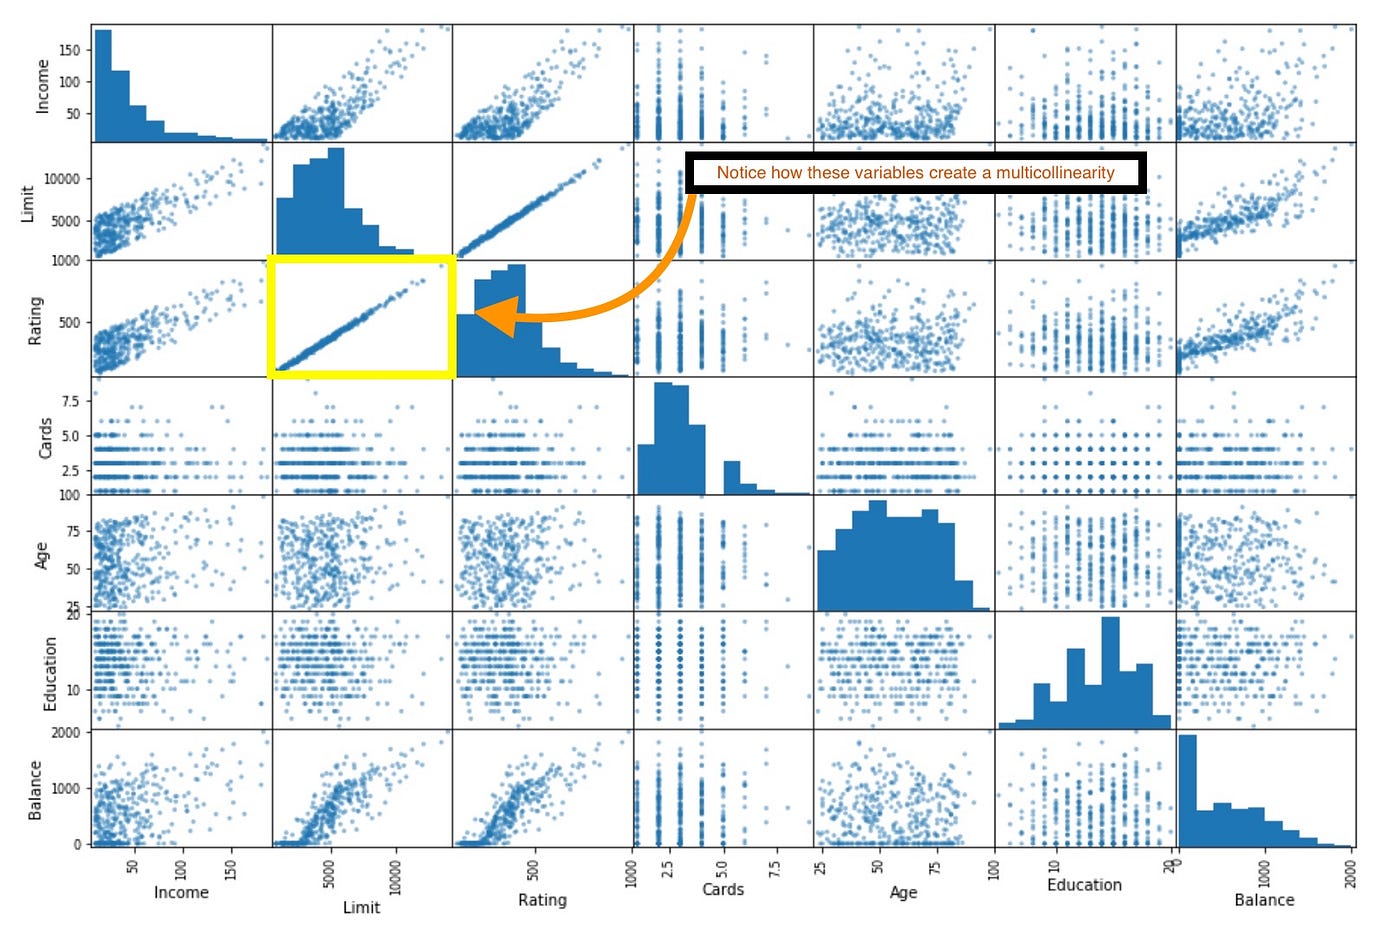
Below is an image of a scatterplot of a sample dataset. The scatterplot of a sample dataset is shown in the image below. Take note of the strong correlation that exists between Limit and Rating. As a result, we are not able to discern the beta coefficients from both, and it suggests multicollinearity.

Figure 1: Scatter plot of variables (Source| Medium)
We may fairly conclude that multicollinearity or collinearity will not alter the outcomes of predictions from decision trees since these problems affect the models’ interpretability or the capacity to conclude from the results. However, it is crucial to consider how each feature might be impacted by another during inference from the decision tree models to aid in making insightful business decisions.
Question 3: How exactly does K-Nearest Neighbor work?
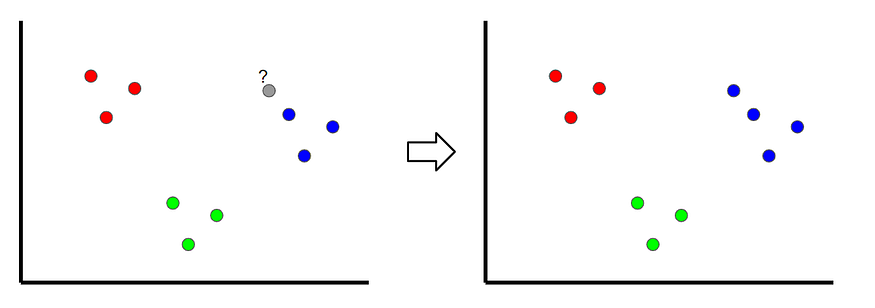
Answer: K-Nearest Neighbors is a technique through which we can classify where a new sample is classified by looking at the nearest classified points, hence the name ‘K-nearest.’ In the example shown below, if k=1, the unclassified point is classified as a blue point.
Outliers may occur if the value of k is too small. If it’s set too high, it can ignore classes with only a few samples.

Figure 2: Example illustrating K-nearest neighbor (Source| Medium)
Question 4: What does the word “naive” refer to in Naive Bayes?
Answer: Naive Bayes is naive since it makes this strong assumption since the features are presumed to be uncorrelated with one another, which is often never the case.
Question 5: When and why would you choose random forests over SVM?
Answer: A random forest is a superior method to a support vector machine for the following reasons:
- Random forests allow us to determine the feature’s importance. SVMs are unable to achieve this.
- A random forest can be constructed more quickly and easily than an SVM.
- SVMs demand a one-vs-rest approach for multi-class classification problems, which is less scalable and memory costly.
Question 6: What distinguishes a Gradient Boosted tree from an AdaBoosted tree?
Answer: AdaBoost is a boosted algorithm similar to Random Forests, but it has a few key distinctions:
- AdaBoost often creates a forest of stumps instead of trees (a stump is a tree with only one node and two leaves).
- The final decision does not weigh each stump equally. The higher influence will go to the stumps with lower overall error and better precision.
- The order in which the stumps are constructed is crucial because each succeeding stump highlights the significance of the samples that the prior stump erroneously categorized.
Similar to AdaBoost, Gradient Boost constructs many trees based on the one before it. Gradient Boost constructs trees with typically 8 to 32 leaves, in contrast to AdaBoost, which constructs stumps.
More precisely, Gradient’s choice trees are constructed differently than AdaBoost’s. Beginning with an initial prediction—usually the average—is gradient enhancement. The decision tree is then constructed using the sample residuals. The initial prediction plus a learning rate multiplied by the residual tree results in a new prediction, which is repeated.
Question 7: How does the bias-variance tradeoff work?
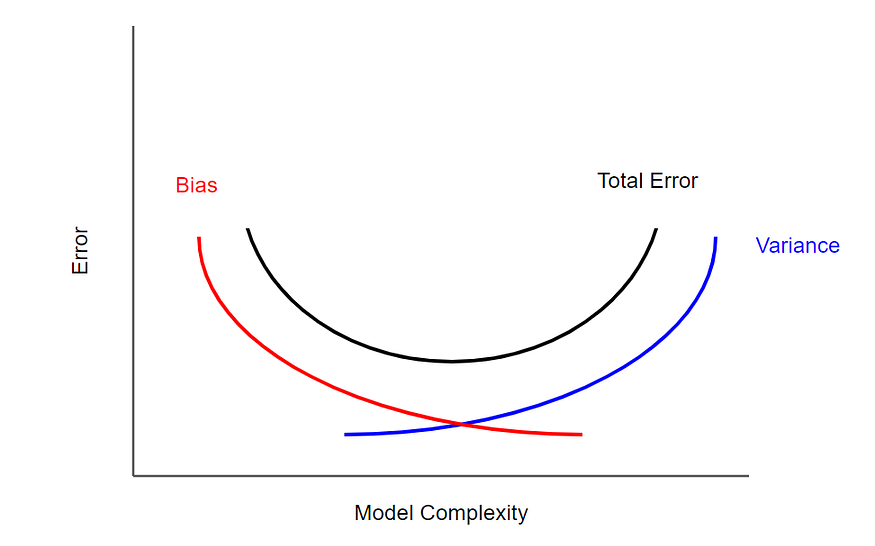
Answer: The difference between an estimator’s true and expected values is called bias. High-bias models are often oversimplified, which leads to underfitting. The model’s sensitivity to the data and noise is represented by variance. Overfitting happens with high variance models.
A characteristic of machine learning models is the bias-variance tradeoff, wherein lower variance leads to increased bias and vice versa. Typically, a balance between the two that minimizes mistakes may be found.

Figure 3: Graph depicting bias-variance trade-off (Source|Medium)
Conclusion
In this article, we covered seven data science interview questions, and the following are the key takeaways:
1. Four necessary assumptions for the linear regression model includes: linearity, homoscedasticity, independence, and normality.
2. A linear relationship between two predictors is called collinearity, and Multi-collinearity refers to the relationship between two or more predictors in a regression model that is strongly linearly related.
3. K-Nearest Neighbors is a technique through which we can classify where a new sample is classified by looking at the nearest classified points, hence the name ‘K-nearest.’
4. Naive Bayes is naive since it makes this strong assumption since the features are presumed to be uncorrelated with one another, which is often never the case.
5. A random forest is a superior method to a support vector machine because Random forests allow us to determine the feature’s importance. SVMs are unable to achieve this.
6. The difference between an estimator’s true and expected values is called bias. High-bias models are often oversimplified, which leads to underfitting. The model’s sensitivity to the data and noise is represented by variance. Overfitting happens with high variance models.
The media shown in this article is not owned by Analytics Vidhya and is used at the Author’s discretion.


