This article was published as a part of the Data Science Blogathon.
Introduction
Streamlit is an open-source tool to build and deploy data applications with less coding compared to other front-end technologies like HTML, CSS, and JavaScript. It is a low-code tool specifically designed for building data science applications.
Moreover, the Streamlit library has functions and methods in pure Python to develop data applications with minimal code. Streamlit also supports various database connections, like AWS S3, MS SQL Server, Oracle DB, spreadsheets, etc.
We will divide the article into three parts: the first part takes you through Streamlit’s core APIs, followed by Streamlit cloud deployment, and in the last part, we will build the Streamlit app to predict road traffic accident severity with code snippets. So, let us delve into the streamlit library to create data web applications.
Streamlit Library’s Core APIs
The Streamlit library provides widgets and UI layout components to develop data-powered web applications. In this section, we’ll look at some of the widgets provided by the library, along with code examples.
1. Text elements
Streamlit has features that allow you to display textual content in the form of titles, headers, subheaders, plain text, and so on. Text elements are useful to display text content on the website with titles and subheaders. Let’s look at some of the examples of text widgets by streamlit.
import streamlit as st

# Title widget
st.title('This is a title')

# plain text wideget
st.text("This is some text")

Using streamlit text elements, we can display texts, captions, and even code or latex formulas without writing extensive code. Let’s see the examples of latex and code widgets as well.
# Code widget example in python language
code = '''def hello():
    print("Hello, Streamlit!")'''

st.code(code, language='python')

# Latex widget example
st.latex(r'''
    a + ar + a r^2 + a r^3 + cdots + a r^{n-1} =
    sum_{k=0}^{n-1} ar^k =
    a left(frac{1-r^{n}}{1-r}right)
    ''')

2. Data display elements
More often than not, in any data science project, we have to showcase datasets to provide a brief overview of the data problem we worked on and the complexity of the dataset. Streamlit has in-built features that allow data scientists to display datasets, tables, and JSON objects with just one line of code.
Let’s look at the examples of data display widgets:
# to display pandas dataframe object
Python Code:
import pandas as pd
import numpy as np
import streamlit as st

df = pd.DataFrame(
np.random.randn(50, 20),
columns=('col %d' % i for i in range(20)))
print(df)
st.dataframe(df)
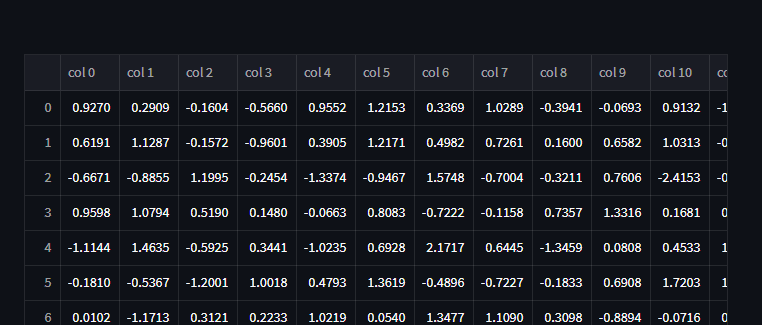
the output of the above code
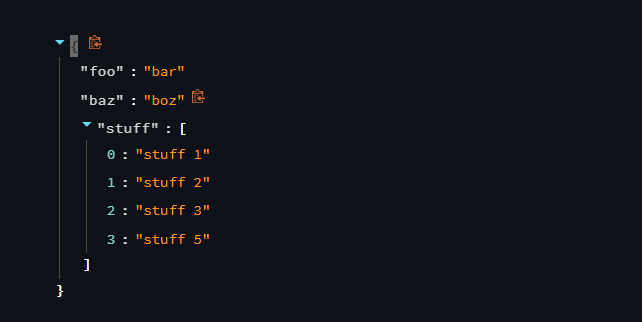
Let’s look at an example to display a JSON object using the streamlit function.
import streamlit as st

st.json({
    'foo': 'bar',
    'baz': 'boz',
    'stuff': [
        'stuff 1',
        'stuff 2',
        'stuff 3',
        'stuff 5',
    ],
})
3. Chart elements
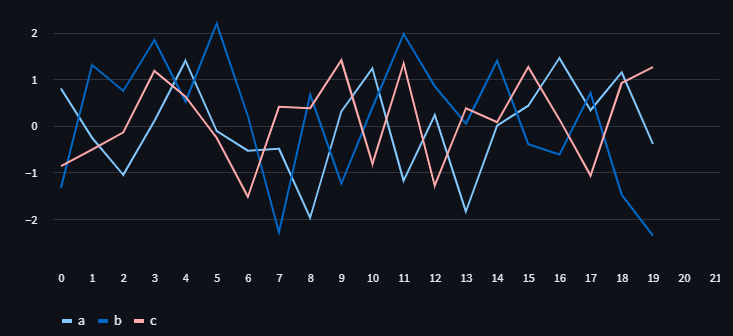
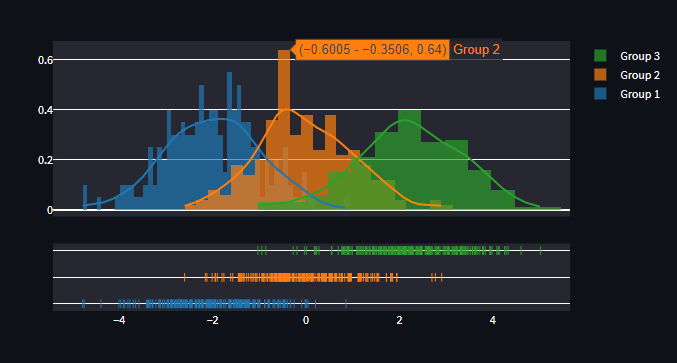
Streamlit provides a series of charts and plot widgets to display data visualizations on the user side. Chart widgets are really useful for displaying insights in a visual format. It is also used for developing dashboards.
Streamlit supports many plots and charts, including line charts, area charts, matplotlib pyplot figure objects, plotly charts, and even map charts to display geographical data using Mapbox’s earth imagery APIs. Let’s look at some the examples of chart widgets.
# Example of line charts
import pandas as pd
import numpy as np
import streamlit as st

chart_data = pd.DataFrame(
    np.random.randn(20, 3),
    columns=['a', 'b', 'c'])

st.line_chart(chart_data)
import numpy as np
import plotly.figure_factory as ff
import streamlit as st

# Add histogram data
x1 = np.random.randn(200) - 2
x2 = np.random.randn(200)
x3 = np.random.randn(200) + 2

# Group data together
hist_data = [x1, x2, x3]

group_labels = ['Group 1', 'Group 2', 'Group 3']

# Create distplot with custom bin_size
fig = ff.create_distplot(
        hist_data, group_labels, bin_size=[.1, .25, .5])

# Plot!
st.plotly_chart(fig, use_container_width=True)
4. Input widgets
Developing an interactive web app where users can enter certain values is crucial for data apps. The majority of data science and machine learning apps are required to take some inputs from users to return predictions of desired outputs to those users.
Streamlit provides several functions to take inputs from users for various use cases, like text-based inputs, selection of options, check boxes, date inputs, file uploads, numerical inputs, slider inputs, and advanced inputs like camera inputs to develop various applications. Let’s look at some examples of input widgets.
# radio widget to take inputs from mulitple options
genre = st.radio(
    "What's your favorite movie genre",
    ('Comedy', 'Drama', 'Documentary'))

if genre == 'Comedy':
    st.write('You selected comedy.')
else:
    st.write("You didn't select comedy.")

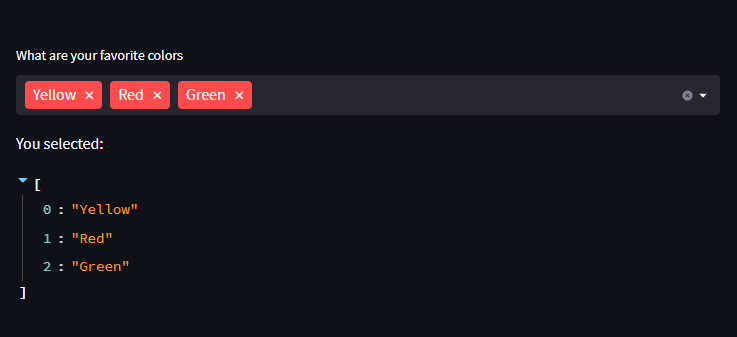
# Usage of multiselect widget
import streamlit as st

options = st.multiselect(
    'What are your favorite colors',
    ['Green', 'Yellow', 'Red', 'Blue'],
    ['Yellow', 'Red'])

st.write('You selected:', options)
Also, check out the demo web application of the same: Click Here
5. Media and Layout elements
When you work with unstructured data like images, audio, and video, you may have to display the media files on the user interface. That is when the media widgets come in handy. Layout widgets help to develop a more user-friendly user interface and can be utilized to customize the user interface using many streamlit functions.
# Displaying images on the front end
from PIL import Image
image = Image.open('sunrise.jpg')

st.image(image, caption='Sunrise by the mountains')
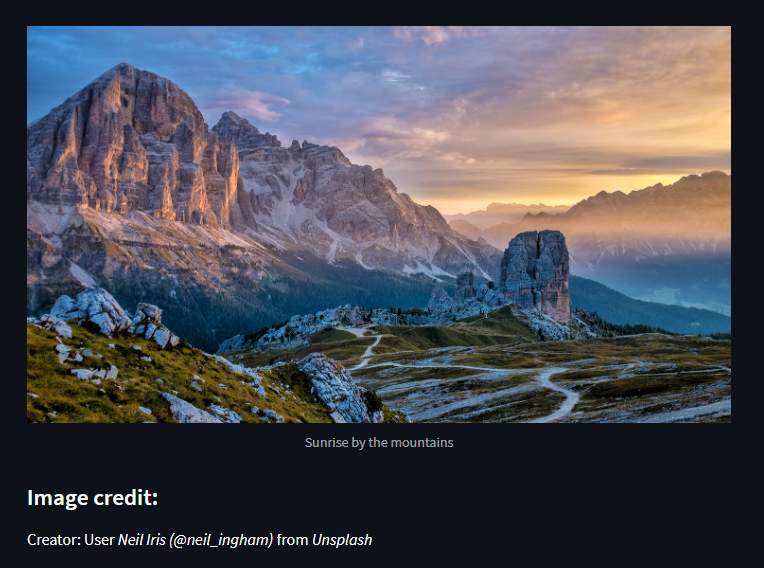
You can check out the example of a web app displaying an image — Click Here
This is not the end of streamlit functionalities, it has many other functions and methods to show charts, the status of the app, control flow, and other utilities to make web apps more interactive to users.
Guide to Deploying Apps on Streamlit Community Cloud
Deploying web applications on streamlit is much easier compared to traditional app deployments. Streamlit Cloud directly launches apps from the Github repository, and it does not require configuration settings at the backend or defining routes for your application.
Streamlit Community Cloud automates the build process and deploys apps without developer intervention. Furthermore, Streamlit supports continuous integration and continuous deployment (CI/CD) pipelines and automatically pulls code changes from the project repository. As an open-source and community cloud project, Streamlit provides all services for free.
Streamlit also provides build logs to troubleshoot errors during the deployment of web apps on the cloud. It provides comprehensive exceptions and error documentation to solve common issues with ease. If the problem persists, contact the streamlit support team for assistance.
Now, let’s look at the steps to deploy your data apps on the streamlit cloud.
1. To deploy an app, you have to click on the “New App” button on the upper right corner of your workspace, and then the below window will pop up.
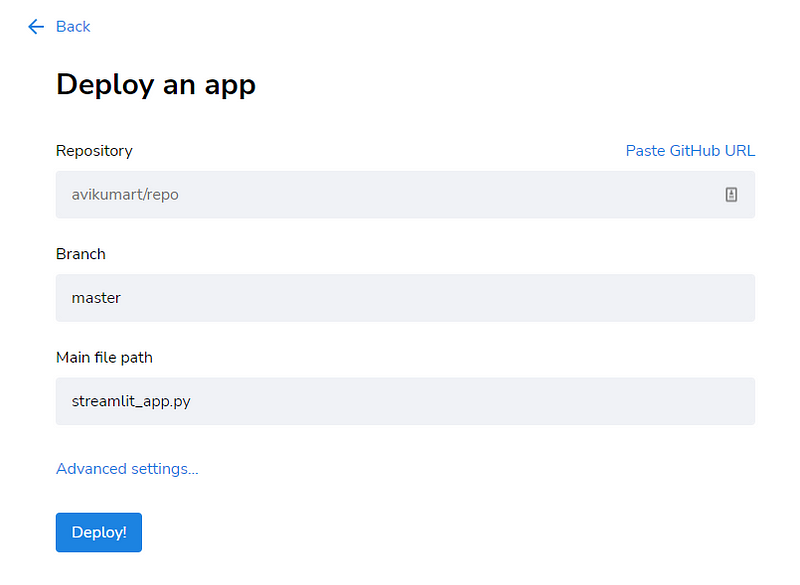
2. After opening the “Deploy an app” window, you have to select the repository where your project files reside, the branch of the project file, and finally main file path to deploy your app in ONE click!
As you can see, we have selected below repository, branch, and path files to deploy the “Road Traffic Severity” classification app.
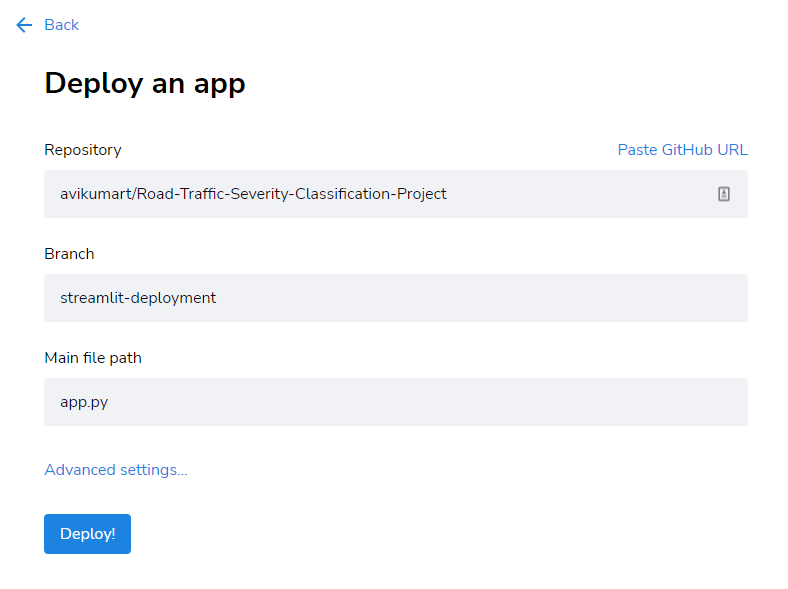
Apart from this, streamlit allows advanced settings to customize the python version and store any API keys depending on your project requirements.
3. Once you click that “Deploy” button, it will automatically deploy the app on the streamlit public cloud and install all the dependencies to run the app. at the end of the build process, you will be redirected to the web portal through the standard URL assigned by streamlit.
The structure of the streamlit app URL looks like as below:
https://[user name]-[repo name]-[branch name]-[app path]-[short hash].streamlit.app
Streamlit also supports various database sources such as AWS S3, BigQuery, MongoDB, MS SQL server, MySQL, and more.
Develop, Build and Deploy a Streamlit App With Source Code
In this section, we will develop a streamlit web application to predict road accident severity and reduce potentially fatal accidents.
The dataset for this application was collected from the Addis Ababa Sub-city Police Department by a master’s degree student for their research work. The dataset had 32 features and 12316 instances to train and test machine learning models. The source of the dataset can be found here.
For the scope of this article, we will only include the development and deployment of a web application. Let’s look at the files to be included in our GitHub repository.
1. app.py (Main path file to be deployed on streamlit cloud)
2. requirements.txt (to install app dependencies for the app to run)
3. model. joblib (developed model for inference)
We will also need the categorical encoder file and image to run the app. Let’s go through the step-by-step guide to deploying the application on the Streamlight Cloud.
# requirements.txt file to install app dependencies
pandas
numpy
streamlit
scikit-learn
joblib
shap
matplotlib
ipython
Pillow
2. Create an app.py file and import necessary libraries as per the requirements.txt file and load the model and categorical encoder object into the python file.
# import necessary libraries
import pandas as pd
import numpy as np
import sklearn
import streamlit as st
import joblib
import shap
import matplotlib
from IPython import get_ipython
from PIL import Image

# load the model and encoder object into the python file.
model = joblib.load("rta_model_deploy3.joblib")
encoder = joblib.load("ordinal_encoder2.joblib")

# set up the streamlit page settings
st.set_option('deprecation.showPyplotGlobalUse', False)
st.set_page_config(page_title="Accident Severity Prediction App",
                page_icon="🚧", layout="wide")
3. Now, set the input options for each application feature. We have 7 categorical features and 3 numerical features to take inputs and get the prediction as an output. For a numerical feature, we can set the values directly in streamlit functions parameters which we will in the next section of the app.
#creating option list for dropdown menu
options_day = ['Sunday', "Monday", "Tuesday", "Wednesday", "Thursday", "Friday", "Saturday"]
options_age = ['18-30', '31-50', 'Over 51', 'Unknown', 'Under 18']

# number of vehical involved: range of 1 to 7
# number of casualties: range of 1 to 8
# hour of the day: range of 0 to 23

options_types_collision = ['Vehicle with vehicle collision','Collision with roadside objects',
                           'Collision with pedestrians','Rollover','Collision with animals',
                           'Unknown','Collision with roadside-parked vehicles','Fall from vehicles',
                           'Other','With Train']

options_sex = ['Male','Female','Unknown']

options_education_level = ['Junior high school','Elementary school','High school',
                           'Unknown','Above high school','Writing & reading','Illiterate']

options_services_year = ['Unknown','2-5yrs','Above 10yr','5-10yrs','1-2yr','Below 1yr']

options_acc_area = ['Other', 'Office areas', 'Residential areas', ' Church areas',
       ' Industrial areas', 'School areas', '  Recreational areas',
       ' Outside rural areas', ' Hospital areas', '  Market areas',
       'Rural village areas', 'Unknown', 'Rural village areasOffice areas',
       'Recreational areas']

# features list for to take input from users
features = ['Number_of_vehicles_involved','Number_of_casualties','Hour_of_Day','Type_of_collision','Age_band_of_driver','Sex_of_driver',
       'Educational_level','Service_year_of_vehicle','Day_of_week','Area_accident_occured']

# set the app heading in markdown form
st.markdown("
Accident Severity Prediction App 🚧
“, unsafe_allow_html=True)
4. Finally, define the main function to take inputs using streamlit methods and set options we have for all the features. we will use the “st. form” method to take each input from the user.
def main():
# take input from users using st.form function
       with st.form("road_traffic_severity_form"):
              st.subheader("Pleas enter the following inputs:")
              # define variable to store user inputs
              No_vehicles = st.slider("Number of vehicles involved:",1,7, value=0, format="%d")
              No_casualties = st.slider("Number of casualities:",1,8, value=0, format="%d")
              Hour = st.slider("Hour of the day:", 0, 23, value=0, format="%d")
              collision = st.selectbox("Type of collision:",options=options_types_collision)
              Age_band = st.selectbox("Driver age group?:", options=options_age)
              Sex = st.selectbox("Sex of the driver:", options=options_sex)
              Education = st.selectbox("Education of driver:",options=options_education_level)
              service_vehicle = st.selectbox("Service year of vehicle:", options=options_services_year)
              Day_week = st.selectbox("Day of the week:", options=options_day)
              Accident_area = st.selectbox("Area of accident:", options=options_acc_area)

              # put a submit button to predict the output of the model
              submit = st.form_submit_button("Predict")

       if submit:
              input_array = np.array([collision,
                                   Age_band,Sex,Education,service_vehicle,
                                   Day_week,Accident_area], ndmin=2)

              # encode all the categorical features
              encoded_arr = list(encoder.transform(input_array).ravel())

              num_arr = [No_vehicles,No_casualties,Hour]
              pred_arr = np.array(num_arr + encoded_arr).reshape(1,-1)
              # predict the output using model object
              prediction = model.predict(pred_arr)

              if prediction == 0:
                     st.write(f"The severity prediction is Fatal Injury⚠")
              elif prediction == 1:
                     st.write(f"The severity prediction is serious injury")
              else:
                     st.write(f"The severity prediciton is slight injury")

              # Explainable AI using shap library for model explanation.
              st.subheader("Explainable AI (XAI) to understand predictions")
              shap.initjs()
              shap_values = shap.TreeExplainer(model).shap_values(pred_arr)
              st.write(f"For prediction {prediction}")
              shap.force_plot(shap.TreeExplainer(model).expected_value[0], shap_values[0],
                              pred_arr, feature_names=features, matplotlib=True,show=False).savefig("pred_force_plot.jpg", bbox_inches='tight')
              img = Image.open("pred_force_plot.jpg")
              # image to display on website
              st.image(img, caption='Model explanation using shap'
if __name__ == '__main__':
   main()
5. Push all the files to the Github repository and deploy the app.py file on the streamlit cloud. You can see the final deployed web application using this link
Conclusion
In this article, we learned a complete guide to developing an app using the Streamlit library as well as building and deploying web applications using the Streamlit community cloud for free. Let’s look at a few takeaways from this article.
- comprehensive overview of the core APIs of the streamlit library for developing the front-end for web applications without knowing HTML, CSS, or JS
- A guide to deploying a web app from the GitHub repository without worrying about backend configuration settings.
- A complete code for developing and deploying a machine-learning web application to predict the severity of road traffic accidents.
The media shown in this article is not owned by Analytics Vidhya and is used at the Author’s discretion.


Super insightful post… Thanks avi