Power BI uses a set of functions, operators, and constants called DAX to perform dynamic computations and analysis. One can enhance their Power BI competency by using DAX features that help in data modeling and reporting. This article examines the top DAX features that any Power BI user should know.

Table of contents
What is Power BI?
Power BI was by Microsoft. It is a business analytics software that enables clients to analyze, view, and share their data. Power BI has ‘wizards’ that are used to create interfaces that can easily manipulate the data. It also provides business intelligence and tools such as graphs and charts through which end users can generate reports and dashboards.
What are DAX Functions?
Some commonly used operators, functions, and constants used in formulae and expressions in Power BI, Power Pivot, and Analysis Services included DAX, which can be used to calculate and even return outcomes.
Among the main attributes of DAX functions are:
- Data Aggregation: Data may be summarized using functions like SUM, AVERAGE, COUNT, and SUMX.
- Filtering: Complex data filters may be defined using functions like FILTER and CALCULATE.
- Time Intelligence: Date and time computations are handled by functions like DATEADD, DATEDIFF, and YEAR.
- Lookup functions: LOOKUPVALUE and other similar functions facilitate the retrieval of relevant data from many tables.
Why is Power BI Essential for Data Analysis?
Power BI is essential for data analysis due to the following reasons:
- Interactive Visualizations: A vast array of dynamic and adaptable data visualizations offered by Power BI facilitate data interpretation and meaningful presentation.
- Real-time Data Access: It facilitates the connectivity of many data sources, including real-time data streams, so that analysis and reporting are up to date.
- Data Transformation and Preparation: Power BI offers an easy way to clean up, transform, and prepare data for analysis in Power Query so users can write a little code.
- Advanced Analytics: Power BI provides for complex calculations and rich analyses. The DAX features an AI built into the system to help the users.
- Integration and Collaboration: Power BI is compatible with Microsoft Excel, Azure, and SharePoint tools. It also enhances teamwork and sharing of different tasks and ideas.
Top DAX Functions in Power BI
Here are some of the most commonly used DAX functions:
- CALCULATE
- SUM and SUMX
- CALCULATETABLE
- RANKX
- DATEDIFF
- DATEADD
- COUNT and COUNTROWS
- LOOKUPVALUE
- FILTER
- RELATED
Below is a sample dataset of the Sales and Products tables that can be used to perform the DAX functions mentioned above.
Sales Table
| OrderID | Date | ProductID | Quantity | UnitPrice | CustomerID | SalesPersonID |
| 1 | 2023-01-01 | P001 | 5 | 10.99 | C001 | SP01 |
| 2 | 2023-01-02 | P002 | 3 | 15.5 | C002 | SP02 |
| 3 | 2023-01-03 | P003 | 2 | 20 | C003 | SP01 |
| 4 | 2023-01-04 | P004 | 1 | 50 | C004 | SP03 |
| 5 | 2023-01-05 | P005 | 4 | 12.99 | C005 | SP02 |
| 6 | 2023-01-06 | P006 | 2 | 25 | C006 | SP01 |
| 7 | 2023-01-07 | P007 | 3 | 18.99 | C007 | SP03 |
| 8 | 2023-01-08 | P008 | 1 | 75 | C008 | SP02 |
| 9 | 2023-01-09 | P009 | 5 | 9.99 | C009 | SP01 |
| 10 | 2023-01-10 | P010 | 2 | 30 | C010 | SP03 |
| 11 | 2023-01-11 | P001 | 3 | 10.99 | C011 | SP02 |
| 12 | 2023-01-12 | P002 | 2 | 15.5 | C012 | SP01 |
| 13 | 2023-01-13 | P003 | 4 | 20 | C013 | SP03 |
| 14 | 2023-01-14 | P004 | 1 | 50 | C014 | SP02 |
| 15 | 2023-01-15 | P005 | 3 | 12.99 | C015 | SP01 |
| 16 | 2023-01-16 | P006 | 2 | 25 | C016 | SP03 |
| 17 | 2023-01-17 | P007 | 1 | 18.99 | C017 | SP02 |
| 18 | 2023-01-18 | P008 | 2 | 75 | C018 | SP01 |
| 19 | 2023-01-19 | P009 | 4 | 9.99 | C019 | SP03 |
| 20 | 2023-01-20 | P010 | 3 | 30 | C020 | SP02 |
| 21 | 2023-01-21 | P001 | 2 | 10.99 | C001 | SP01 |
| 22 | 2023-01-22 | P002 | 1 | 15.5 | C002 | SP03 |
| 23 | 2023-01-23 | P003 | 3 | 20 | C003 | SP02 |
| 24 | 2023-01-24 | P004 | 2 | 50 | C004 | SP01 |
| 25 | 2023-01-25 | P005 | 1 | 12.99 | C005 | SP03 |
| 26 | 2023-01-26 | P006 | 4 | 25 | C006 | SP02 |
| 27 | 2023-01-27 | P007 | 2 | 18.99 | C007 | SP01 |
| 28 | 2023-01-28 | P008 | 1 | 75 | C008 | SP03 |
| 29 | 2023-01-29 | P009 | 3 | 9.99 | C009 | SP02 |
| 30 | 2023-01-30 | P010 | 2 | 30 | C010 | SP01 |
Products Table
| ProductID | ProductName | Category | Cost | LaunchDate |
| P001 | Premium Widget | Electronics | 8.5 | 2022-01-15 |
| P002 | Deluxe Gadget | Home | 12 | 2022-02-01 |
| P003 | Super Tool | Hardware | 15.5 | 2022-03-10 |
| P004 | Luxury Device | Electronics | 40 | 2022-04-05 |
| P005 | Economy Appliance | Home | 10 | 2022-05-20 |
| P006 | Pro Gizmo | Electronics | 20 | 2022-06-15 |
| P007 | Smart Doohickey | Home | 14.5 | 2022-07-01 |
| P008 | Mega Machine | Hardware | 60 | 2022-08-10 |
| P009 | Basic Widget | Electronics | 7.5 | 2022-09-05 |
| P010 | Advanced Gadget | Home | 25 | 2022-10-20 |
1. CALCULATE
The CALCULATE function is among the strongest DAX formula. It evaluates an expression in the context of a changed filter. With CALCULATE, you may alter the environment in which data is filtered, enabling more adaptable and dynamic computations.
Syntax:
CALCULATE(<expression>, <filter1>, <filter2>...)Example:
Electronics Sales =
CALCULATE(
    SUM(Sales[Quantity]),
    Products[Category] = "Electronics"
)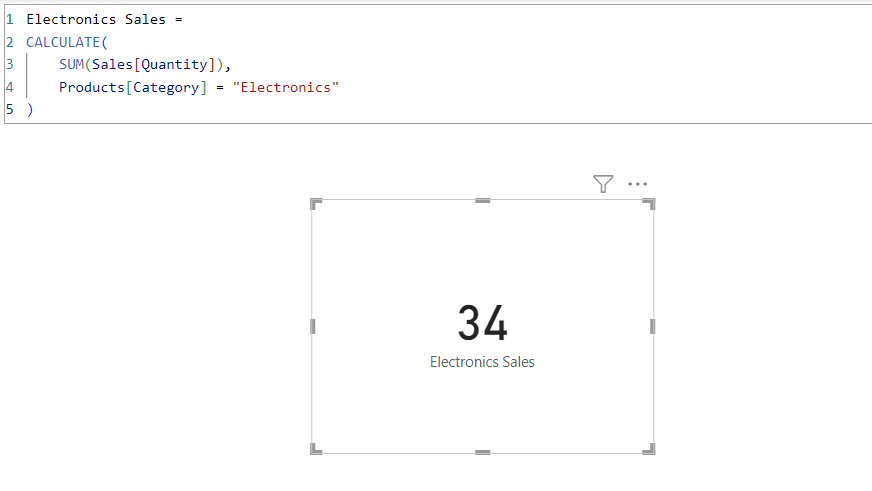
Explanation:
This measure calculates the total sales for electronics products only.
- The expression
SUM(Sales[Quantity] * Sales[UnitPrice])calculates the total sales. - The filter
Products[Category] = "Electronics"modifies the context to include only products in the Electronics category. - CALCULATE applies this filter, overriding any existing filters on the Products table.
2. SUM and SUMX
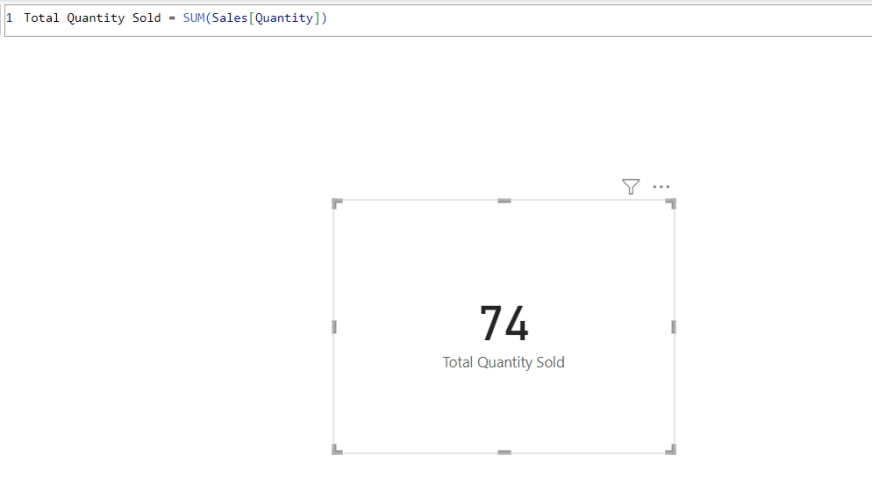
The SUM function is straightforward, summing up all values in a column. SUMX, on the other hand, is an iterator function that sums up the results of an expression evaluated for each row in a table.
Syntax:
SUM(<column>)
SUMX(<table>, <expression>)
Example:
Total Quantity Sold = SUM(Sales[Quantity])
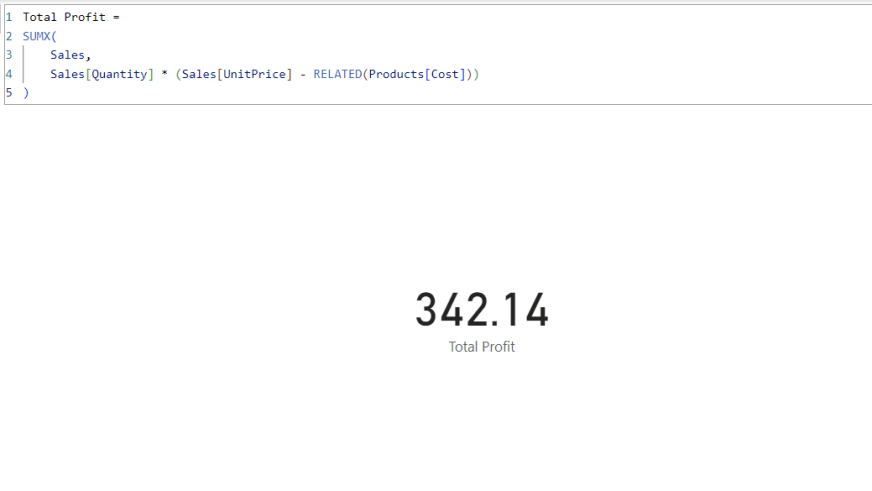
Total Profit =
SUMX(
Sales,
Sales[Quantity] * (Sales[UnitPrice] - RELATED(Products[Cost]))
)
Explanation:
- SUM operates on a single column or on an expression that results in a column of values. It adds up all the values in that column, respecting any filter context that’s in place. It’s efficient for simple summations but limited when you need row-by-row calculations involving multiple columns or related tables.
- SUMX iterates over each row in the specified table (Sales in this case). For each row, it evaluates the given expression:
Sales[Quantity] * (Sales[UnitPrice] - RELATED(Products[Cost]))- It multiplies the quantity sold by the difference between the unit price and the product cost.
- RELATED(Products[Cost]) brings in the cost from the Products table for each product.
- After calculating this for each row, SUMX sums up all the results.
3. CALCULATETABLE
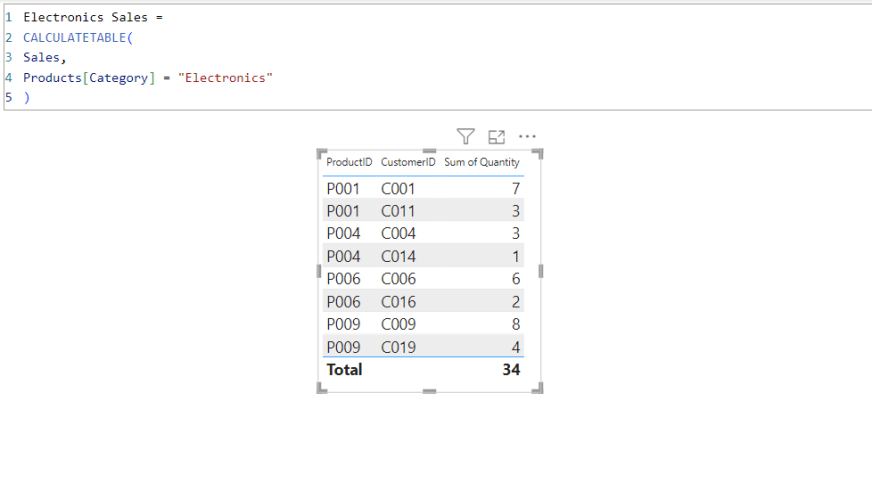
CALCULATETABLE evaluates a table expression in a modified filter context, similar to how CALCULATE works with scalar expressions.
Syntax:
CALCULATETABLE(<table_expression>, <filter1>, <filter2>,...)Example:
Electronics_Sales =
CALCULATETABLE(
Sales,
Products[Category] = "Electronics"
)
Explanation:
- It starts with the entire Sales table.
- It then applies the filter
Products[Category] = "Electronics". - This filter is applied through the relationship between Sales and Products tables. The result is a subset of the Sales table containing only sales of electronic products.
- This function is handy for creating virtual tables filtered according to specific criteria.
4. RANKX
RANKX ranks items in a table based on an expression. It helps create rankings within a data set.
Syntax:
Rankx(<table>,<expression>,<value>(optional),<order>(optional),<ties>(optional))Example:
RANKX(
    ALL(Sales[SalesPersonID]),
    CALCULATE(SUM(Sales[Quantity] * Sales[UnitPrice]))
)
Explanation:
- The expression CALCULATE(SUM(Sales[Quantity] * Sales[UnitPrice])) calculates the total sales amount for each salesperson.
- RANKX evaluates the expression for each row in the specified table.
- It then assigns a rank based on the result of that expression.
- By default, RANKX assigns a lower rank (closer to 1) for higher values.
In Power BI, RANKX helps in generating rankings dynamically within reports.
5. DATEDIFF
The DATEDIFF function calculates the difference between two dates.
Syntax:
Duration = DATEDIFF(StartDate, EndDate, DAY)Example
Days Since Launch =
DATEDIFF(
    Products[LaunchDate],
    MAX(Sales[Date]),
    DAY
)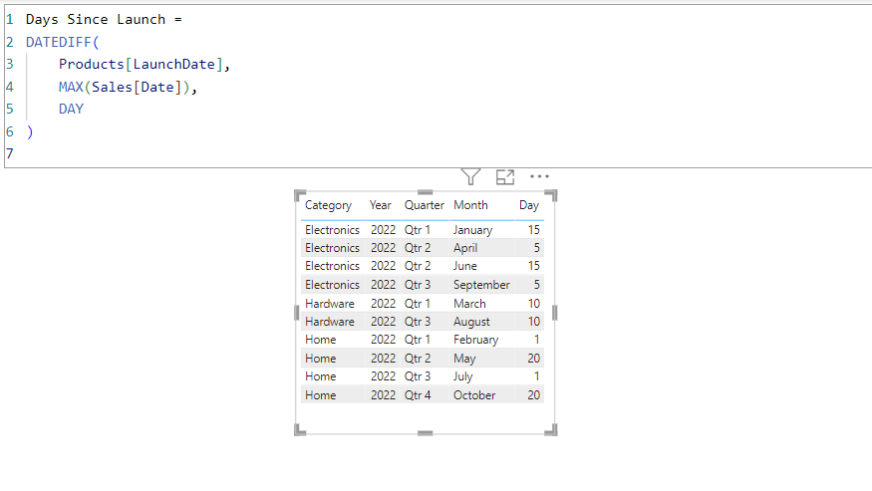
Explanation:
This measure calculates the number of days between each product’s launch date and the latest sale date.
- Products[LaunchDate] is the start date.
- MAX(Sales[Date]) finds the latest sale date in the current context.
- DAY specifies that the difference should be calculated in days.
In Power BI, DATEDIFF helps calculate the time elapsed between two dates in various units (days, months, years).
6. DATEADD
DATEADD shifts a date by a specified number of intervals. It helps create comparisons over time.
Syntax:
DATEADD(<dates>, <number_of_intervals>, <interval>)Example:
NewLaunchDate = DATEADD(Products[LaunchDate], 1, MONTH)Explanation:
In Power BI, DATEADD enables time intelligence operations, such as comparing the current month’s data to the previous month’s.
7. COUNT and COUNTROWS
While COUNTROWS counts the number of rows in a table, COUNT counts the number of non-empty values in a column.
Example:
CustomerCount = COUNT(Sales[CustomerID])
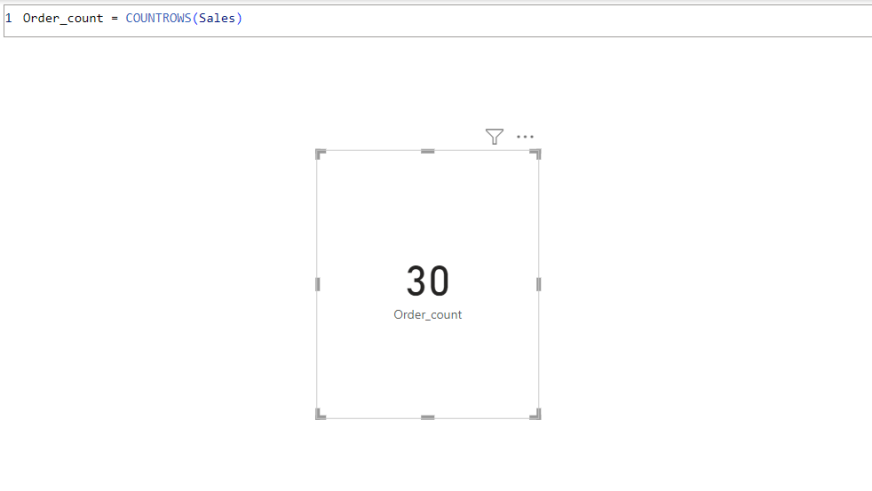
OrderCount = COUNTROWS(Sales)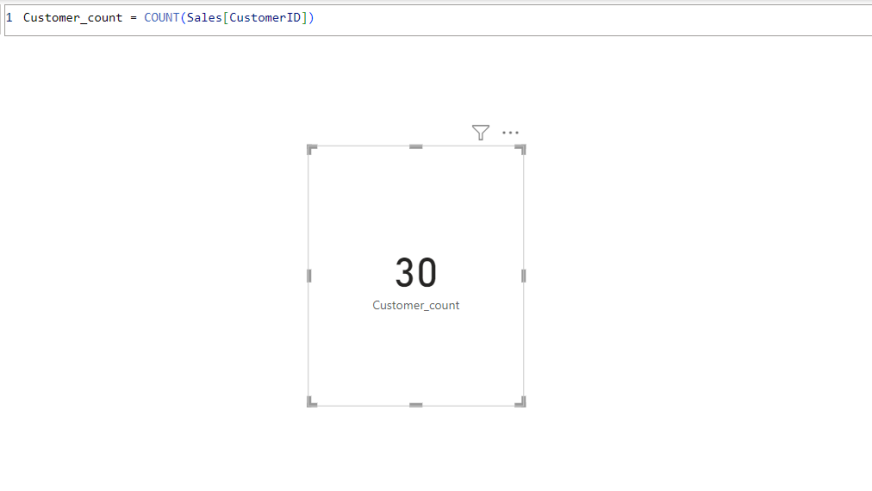
Explanation:
- COUNT on CustomerID column: This will count the number of non-blank entries in the CustomerID column.
- COUNTROWS on the entire Sales table: This will count the total number of rows in the table.
In Power BI, these functions help determine the size of a dataset or subset.
8. LOOKUPVALUE
LOOKUPVALUE retrieves the value of a column in a table, akin to a VLOOKUP in Excel.
Syntax:
LOOKUPVALUE(<result_column>, <search_column1>, <search_value1> [, <search_column2>, <search_value2> [, … ] ] )Example:
ProductCost = LOOKUPVALUE(Products[Cost], Products[ProductID], "P003")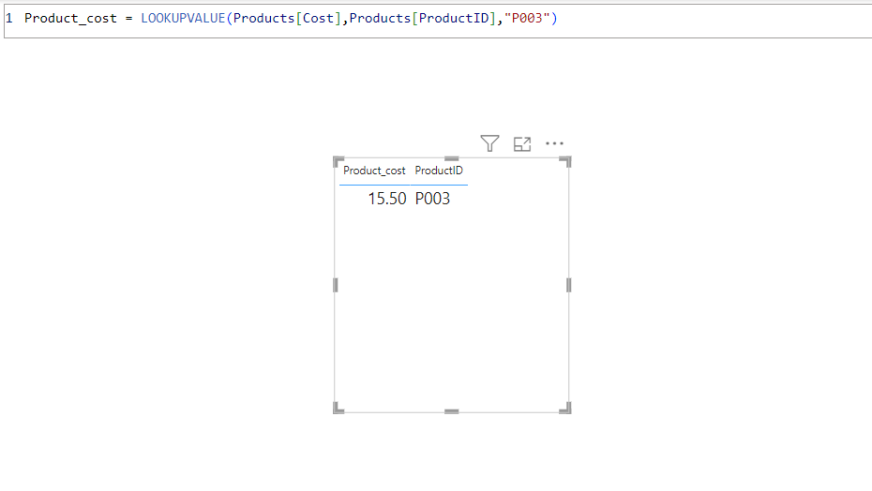
Explanation:
result_column: The column from which you want to return the value.search_column1: The column where you search for the value.search_value1: The value you want to find in thesearch_column1.- This formula searches the
Productstable for theProductID“P003” and returns the correspondingCost.
In Power BI, LOOKUPVALUE is essential for fetching related data from different tables.
9. FILTER
The FILTER function returns a table representing a subset of another table filtered by a given expression.
Syntax:
FILTER(<table>,<filter>)Example:
FilteredProducts = FILTER(
    Products,
    Products[Category] = "Electronics" && Products[Cost] > 10
)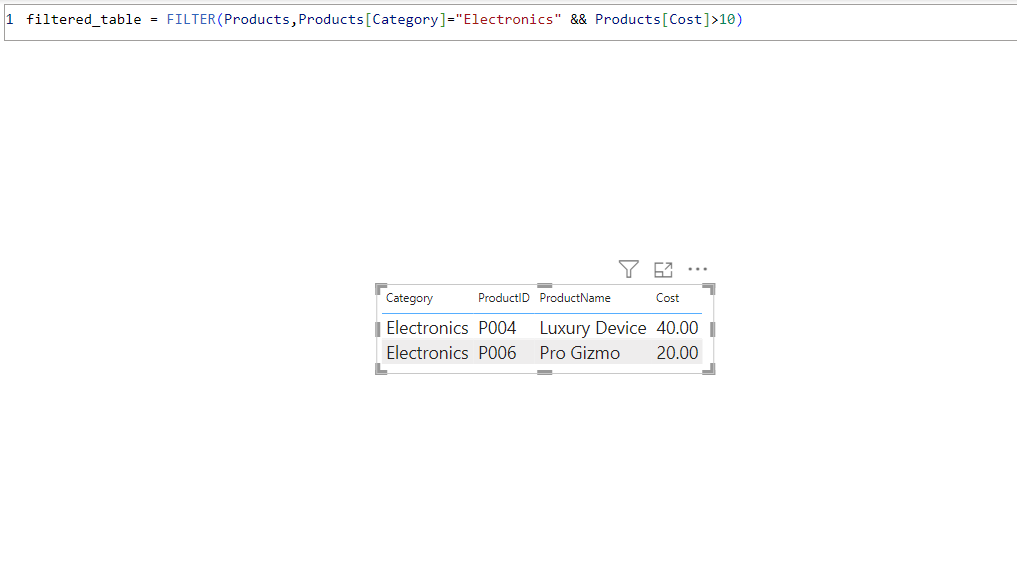
Explanation:
This condition consists of two parts combined with the logical AND operator (&&):
Products[Category] = "Electronics": This part of the condition filters the rows where theCategoryis “Electronics”.Products[Cost] > 10: This part of the condition further filters those rows where theCostis greater than 10.
In Power BI, FILTER is used to narrow down data based on specific conditions.
10. RELATED
The RELATED function fetches a related value from another table, leveraging the relationships between tables.
Syntax:
RELATED(<Column>)Example:
Category Description = RELATED(Categories[Description])Explanation:
This DAX expression fetches the Description from the Categories table for each row in the Products table based on the relationship defined between the Category columns of both tables.
In Power BI, RELATED is crucial for retrieving data from related tables.
Conclusion
Proficiency with these Power BI DAX functions will significantly improve your data analysis and modeling capacity. Understanding and efficiently using functions like CALCULATE, SUMX, RANKX, DATEDIFF, and LOOKUPVALUE will enable you to perform intricate computations and produce dynamic, informative results. The DAX functions in Power BI provide the tools to transform unstructured data into insightful information, whether doing total calculations, rating data, or working with date values.
If you want to learn about DAX for Power BI in-depth, here is a YouTube tutorial for you: Hands-on with Data Analysis Expressions (DAX) for Power BI
Frequently Asked Questions
Q1. How many functions are there in DAX?
A. DAX includes over 250 functions. These functions are used for various data manipulations, including aggregation, filtering, time intelligence, and more, to perform complex calculations in Power BI, Power Pivot, and Analysis Services.
Q2. What is the DAX formula in Power BI?
A. A DAX formula is an expression used to perform calculations on data in Power BI. It consists of functions, operators, and constants to create dynamic calculations and aggregations, such as CALCULATE(SUM(Sales[Amount]), Sales[Region] = “West”).
Q3. What are DAX queries in Power BI?
A. Expressions written in DAX language retrieve, filter, and analyze data in Power BI. Users create custom calculations, aggregations, and query tables or columns, providing powerful data manipulation capabilities beyond standard report-building.
Q4. What is the full form of DAX?
A. The full form of DAX is Data Analysis Expressions.
A 23-year-old, pursuing her Master's in English, an avid reader, and a melophile. My all-time favorite quote is by Albus Dumbledore - "Happiness can be found even in the darkest of times if one remembers to turn on the light."


You have a way of making even the most challenging topics seem approachable and understandable.