Introduction
Navigating the complexities of data analytics in today’s dynamic environment can be daunting. One effective approach for uncovering hidden patterns in time series data is using Moving Averages. This comprehensive guide explores the intricacies of Moving Averages in python, offering insights into their methodologies and diverse applications across various industries.

Overview
- Explore how Moving Averages smooth data to uncover long-term patterns in dynamic datasets.
- Learn how Moving Averages enhances trend visibility and reduces time-series data noise.
- Implement Moving Averages in Python to analyze trends and make informed decisions.
- Discover how Moving Averages are used in finance, economics, and beyond for trend identification and forecasting.
- Understand the differences between Simple Moving Averages and Exponential Moving Averages and their respective applications.
- Gain insights into how Moving Averages mitigate rapid data changes and provide stable trend analysis.
Table of contents
What are Moving Averages?
Moving Averages is a statistical method in data analysis that smooths fluctuations in time-series data to reveal underlying trends. Calculating the average within a specified window and shifting it through the dataset provides a clearer trend representation. It is widely applied in finance, economics, and signal processing,
Let us understand this with an example:
Consider a stock price chart, where sudden spikes and troughs make it challenging to understand the bigger picture. A moving average helps to even out these variations by figuring out the average price over a given period of time. The average is continually computed as new data points are added, producing a line that depicts the underlying trend.
Why are Moving Averages Important?
Here’s why MAs are crucial for data analysis:
- Trend Identification: MAs help reveal whether data is trending upwards (increasing average), downwards (decreasing average), or remaining relatively flat (stable average). This helps in understanding the general trend.
- Support and Resistance Levels (Financial Markets): MAs can act as dynamic support and resistance levels in financial markets, where prices might find temporary pause or reversal points.
- Comparison Points: MAs can be used as a baseline for comparison. Deviations from the average can indicate potential turning points or periods of significant change.
- Noise Reduction: By filtering out short-term fluctuations(or noise), MAs make it easier to identify long-term patterns and cycles that might otherwise be hidden in the raw data.
Also Read: Introduction to Time Series Analysis and Forecasting
How Does Moving Average Work?
Here’s the breakdown of how Moving Average works:
- Choose a window size: This is the number of data points you’ll use to calculate the average. Let’s say you pick a 7-day window.
- Calculate the initial average: You might not have enough data points for the first few days (less than the window size). But once you have seven days of data, you simply add up the website visits for those seven days and divide by seven. This gives you the average traffic for the first seven-day period.
- Slide the window: Now, let’s move forward one day. You discard the first data point from your calculation and add the data for the new day (the 8th day). Recalculate the average using these 7 data points. This gives you the average traffic for the most recent 7-day period.
- Repeat: As you have new data for each day, discard the oldest point, including the newest one, and recalculate the average. This creates a continuously updated line representing the moving average.
Smoothing the Data fluctuations
There are two key ways moving averages smooth out data fluctuations:
- Averaging Out the Extremes: Moving averages replace individual data points with their average within a set window. This means extreme highs and lows in the data are brought closer to the center, reducing their impact on the overall trend.
- Dampening the Rapid Changes: They introduce a lag when previous data points are considered. This means the average reflects past trends and changes in the data with a slight delay. This lag acts as a natural filter, dampening out rapid fluctuations that might just be temporary noise or short-term volatility.
Also Read: A Comprehensive Guide to Time Series Analysis and Forecasting
Lag in Moving Average
Lag is the delay between a change in the actual data and its reflection in the moving average. This happens because MAs rely on past data points to calculate the average.
- Cause of Lag: Since moving averages consider a set of previous data points, they can’t react instantaneously to changes in the current data. This inherent delay creates the lag.
- Impact on Trend Identification: Lag can make MAs slower to detect new trends, especially when they emerge quickly.
- Severity of Lag: The severity of lag depends on the chosen window size. A larger window size smooths out more data points, leading to a greater lag. Conversely, a smaller window size reacts faster to changes but might still be influenced by short-term fluctuations.
Types of Moving Average
There are majorly two types of Moving Averages:
Simple Moving Average (SMA)
The SMA is the most basic and easiest-to-understand type of moving average. It’s the average closing prices (or any other data point) over a chosen window size.
Formula: SMA(t) = (Data(t-n+1) + Data(t-n+2) + … + Data(t)) / n
Here, t represents the current period, n is the window size, and Data(t) refers to the data point at time t.
Exponential Moving Average (EMA)
The EMA assigns greater weight to more recent data points, giving them a stronger influence on the average. This allows the EMA to react faster to changes in the data compared to the SMA.
Formula: EMA(t) = α * Price(t) + (1 – α) * EMA(t-1)
Here, α is a smoothing factor (typically between 0.02 and 0.3) that determines the weight given to the current price (Price(t)). A higher α puts more emphasis on recent data.
Implementing Moving Average in Python
Here’s a step-by-step guide with code examples:
Import Libraries and Load Data
import pandas as pd
import numpy as np

# Load your data into a pandas DataFrame
data = pd.read_csv('data.csv')

# Specify the data column you want to calculate the moving average for (e.g., 'Close Price')
data_column = 'Close Price'
#import csv
Calculate Simple Moving Average (SMA)
There are two approaches to calculate the SMA:
Using a loop
window_size = 20  # Define your window size

# Create an empty list to store SMA values
sma_values = []

for i in range(len(data)):
  # Check if window size is within data boundaries
  if i < window_size:
	sma_values.append(np.nan)  # Add Not a Number (NaN) for initial points where window is incomplete
  else:
	# Calculate SMA using NumPy's sum function
	sma_values.append(np.sum(data[data_column][i-window_size:i]) / window_size)

# Add the SMA column to your DataFrame
data['SMA'] = sma_values
Using pandas’ rolling window functionality (more efficient)
window_size = 20  # Define your window size

# Calculate SMA using pandas' rolling mean function
data['SMA'] = data[data_column].rolling(window=window_size).mean()
Calculate Exponential Moving Average (EMA)
window_size = 20 # Define your window size
alpha = 2 / (window_size + 1) # Smoothing factor (adjust based on needs)
# Calculate EMA using a loop (illustrative purposes)
ema_values = []
for i in range(len(data)):
if i == 0:
ema_values.append(data[data_column].iloc[0]) # Initial EMA equals first data point
else:
ema_values.append(alpha * data[data_column].iloc[i] + (1 - alpha) * ema_values[i-1])
# Add the EMA column to your DataFrame
data['EMA'] = ema_values
# Alternatively, use pandas' ewm function for a more efficient EMA calculation
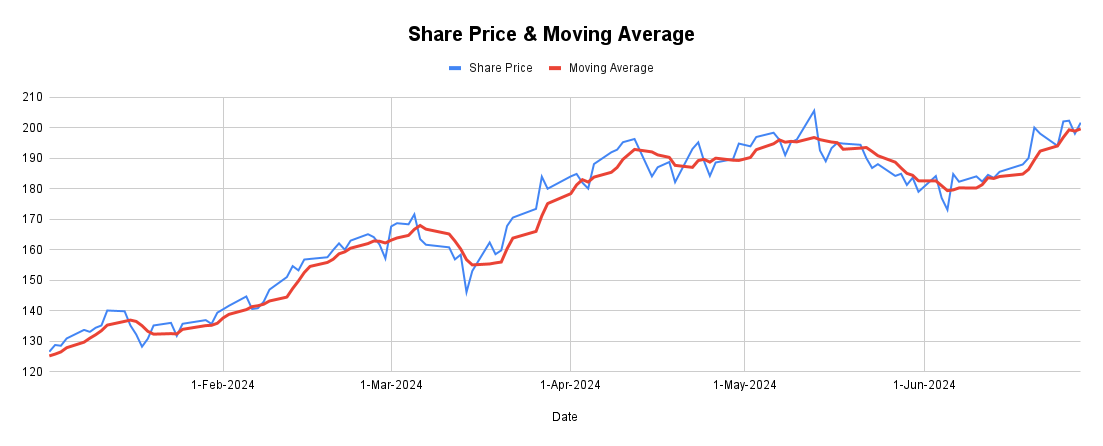
data['EMA'] = data[data_column].ewm(alpha=alpha, min_periods=window_size).mean()Plot the Results
import matplotlib.pyplot as plt

# Plot original data, SMA, and EMA
plt.plot(data[data_column], label='Original Price')
plt.plot(data['SMA'], label='SMA')
plt.plot(data['EMA'], label='EMA')

# Customize your plot (labels, title, legend)
plt.xlabel('Date')
plt.ylabel('Price')
plt.title('Moving Averages')
plt.legend()
plt.show()
Output


Application of Moving Averages
Here are some key applications of moving averages in data analysis, presented as simple points:
- Trend Identification: Rising MAs indicate uptrends while falling MAs suggest downtrends.
- Smoothing Out Noise: MAs filter out short-term fluctuations, revealing underlying trends.
- Support and Resistance (Financial Markets): MAs can act as dynamic support and resistance levels, where prices might find temporary pause or reversal points.
- Signal Generation: Traders use MAs to generate buy/sell signals based on crossovers with other indicators or price data (applicable to financial markets).
- Forecasting: By analyzing past trends identified by MAs, you can make informed predictions about future data points (works best when trends are likely to continue).
- Comparison Points: Deviations from the MA can indicate potential turning points or periods of significant change.
- Inventory Management: MAs can help forecast demand and optimize inventory levels.
- Website Traffic Analysis: MAs can smooth out daily fluctuations in website traffic, revealing long-term trends in user engagement.
Conclusion
Moving averages are an essential tool in data analysis for identifying trends and smoothing out fluctuations in time-series data. By averaging data points over a specified window, moving averages provide a clearer view of underlying patterns, making it easier to get long-term trends amidst short-term volatility. They help in trend identification, noise reduction, support and resistance level determination, and signal generation.
Implementing moving averages through simple moving averages (SMA) or exponential moving averages (EMA) is straightforward and can be efficiently done using programming languages like Python. Understanding and utilizing moving averages in python effectively can greatly enhance data-driven decision-making and predictive analytics.
Frequently Asked Questions
Q1. What are Moving Averages?
Ans. In data analysis, moving averages are like a moving average speed indicator for your data. They smooth out short-term ups and downs, revealing the general trend.
Q2. Why moving averages are important?
Ans. Moving averages are important for data analysis because they simplify complex data by:
1. Smoothing out fluctuations, revealing underlying trends.
2. Help identify trends, up, down, or sideways.
3. Can generate signals for entry/exit points in trades.
Q3. What is the difference between a Simple Moving Average and an Exponential Moving average?
Ans. The key difference between Simple Moving Average (SMA) and Exponential Moving Average (EMA) is how they weigh data points:
1. SMA: This method treats all data points within the chosen period equally. It’s like a simple average.
2. EMA: Gives more weight to recent data points, making it more responsive to recent changes.
This difference makes SMA smoother but slower to react, while EMA is more reactive but can be jumpier.
Data Analyst with over 2 years of experience in leveraging data insights to drive informed decisions. Passionate about solving complex problems and exploring new trends in analytics. When not diving deep into data, I enjoy playing chess, singing, and writing shayari.


