Introduction
Have you ever been fooled by statistics? Simpson’s paradox shows how analyzing data in total can obscure important trends. We can uncover hidden factors that reverse or eliminate relationships by breaking down information. This short guide will equip you to avoid being misled by aggregated data and ensure you see the whole picture.

Overview
- Simpson’s Paradox highlights how aggregated data can obscure trends seen in individual subgroups.
- Famous examples include the UC Berkeley admissions case, where gender bias appeared but disappeared upon deeper analysis.
- COVID-19 data showed higher mortality in vaccinated individuals until age and health factors were considered.
- The paradox typically arises from confounding variables and omitted variable bias in data analysis.
- To avoid Simpson’s Paradox, always analyze data at multiple levels and account for potential hidden factors.
Table of contents
What is Simpson’s Paradox?
Simpson’s Paradox is a statistical phenomenon. It occurs when trends in subgroups disappear or reverse in combined data. This paradox can lead to misleading conclusions. It’s crucial in data analysis across many fields. Examples include medical research and social sciences. The paradox affects how we interpret study results. It shows why examining subgroups is important. Analysts must look beyond overall trends. They need to consider underlying factors. Simpson’s Paradox reminds us that data can be complex. It highlights the need for thorough statistical analysis. Understanding this concept helps prevent incorrect interpretations of data.
Let’s understand Simpson’s Paradox better with some examples!
UC Berkeley Gender Admissions Case
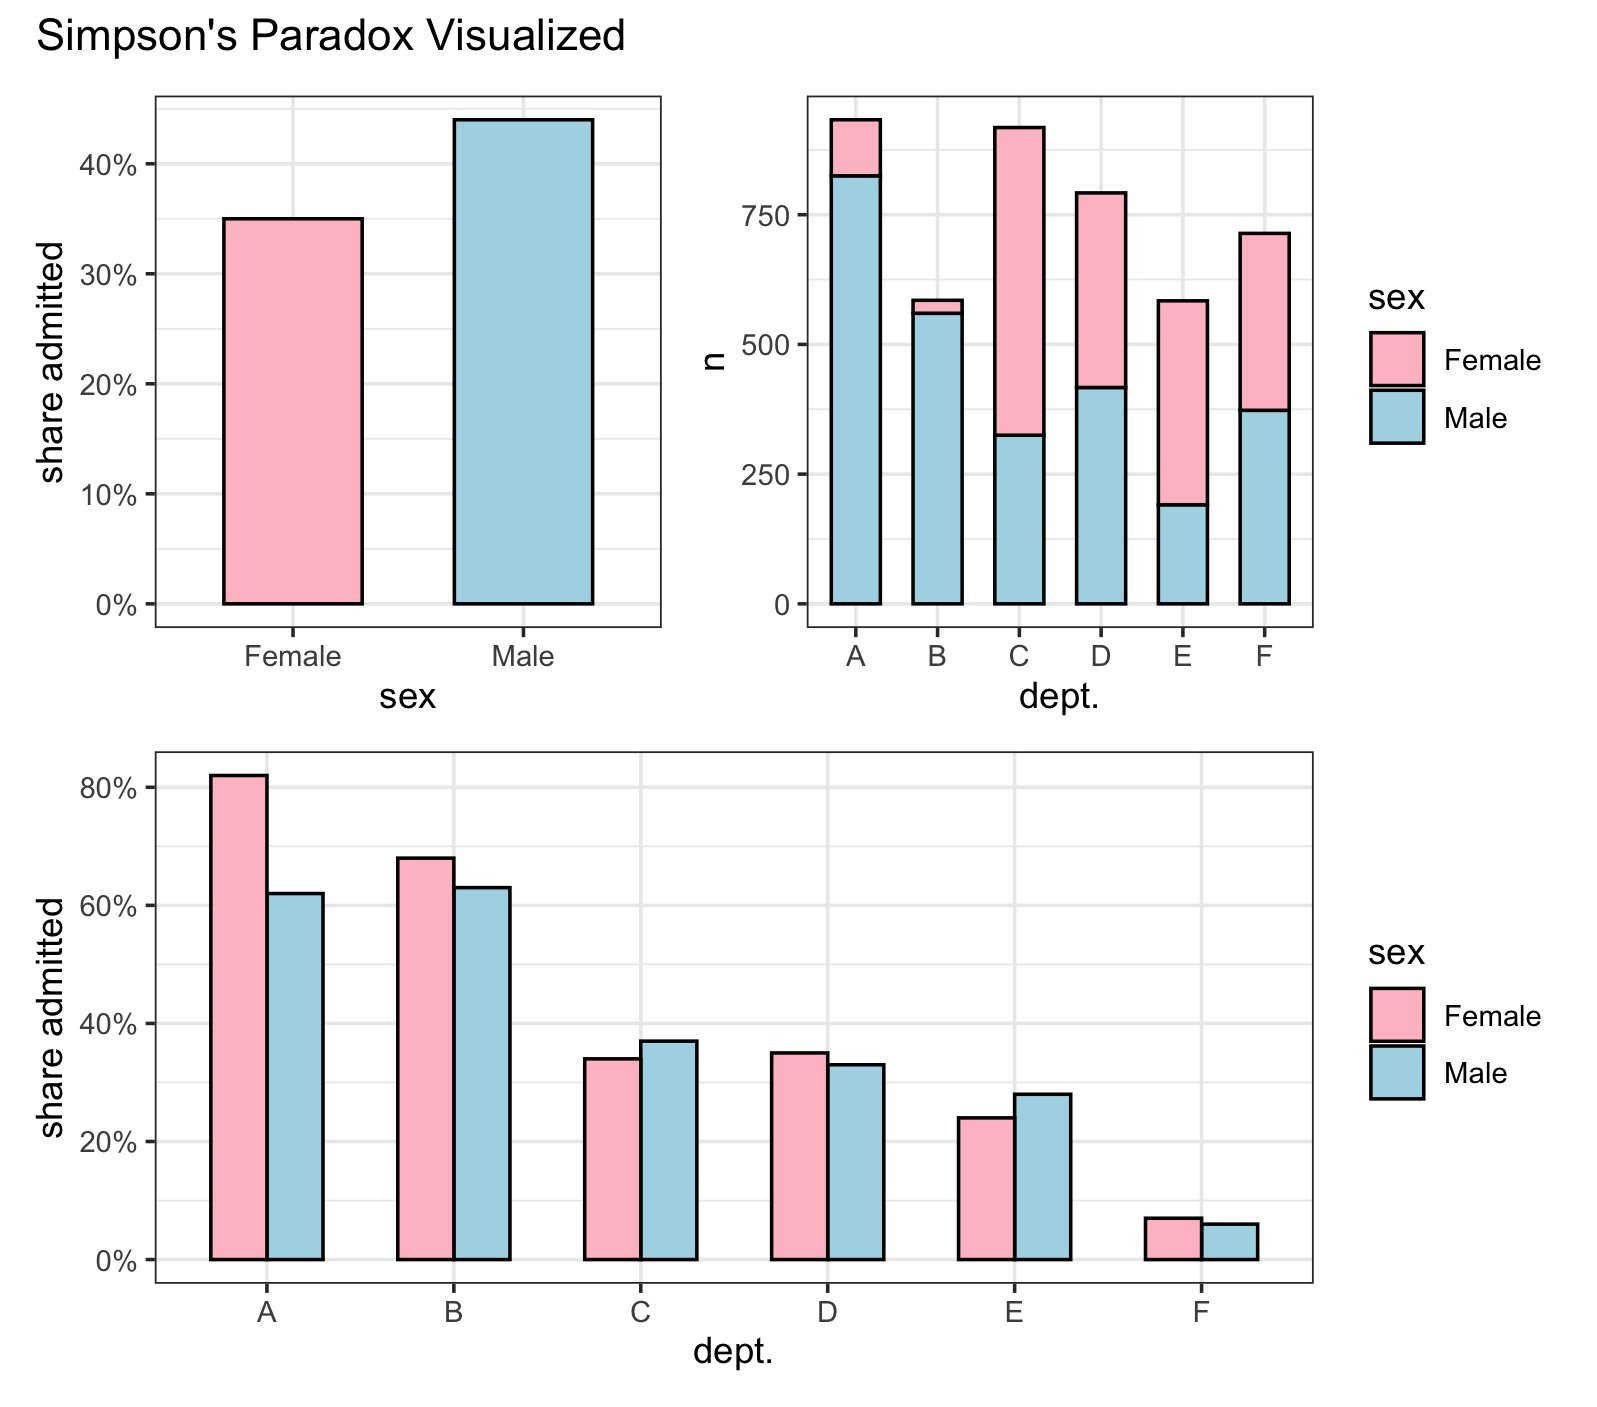
One of the most famous examples of Simpson’s Paradox is the UC Berkeley gender admissions case. Initially, male applicants appeared to have a significantly higher acceptance rate than female applicants, suggesting possible gender bias. The aggregated data showed:
- Men: 45% acceptance rate
- Women: 30% acceptance rate
However, upon disaggregating the data by department, a different picture emerged. Women tended to apply to more competitive departments with lower acceptance rates, whereas men applied to departments with higher acceptance rates. When analyzing the data within each department, the gender bias disappeared, and in some cases, women had higher acceptance rates than men. This demonstrates how data aggregation can obscure the true relationship between variables.
COVID-19 Vaccination and Mortality Rates
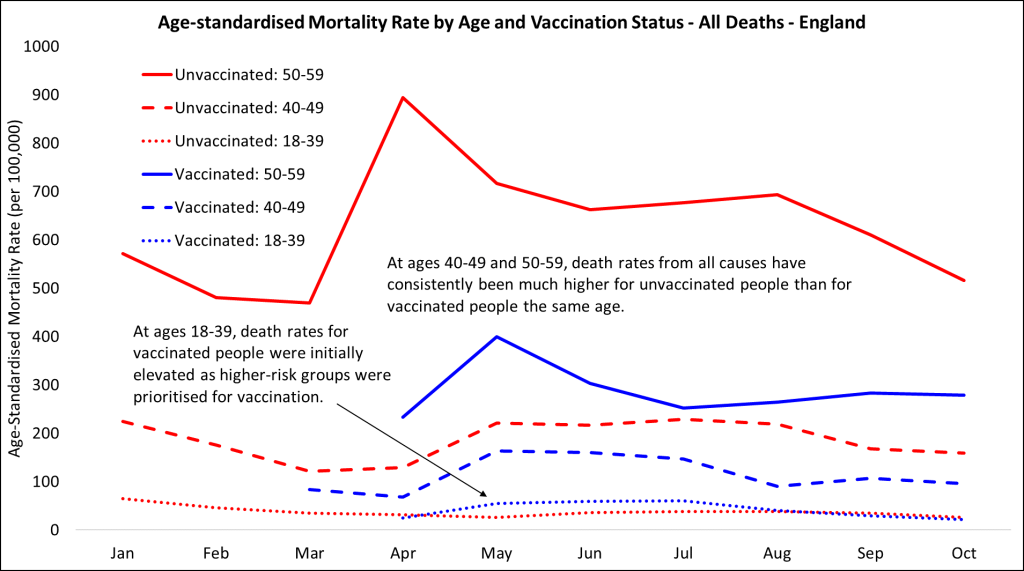
During the COVID-19 pandemic, data showed that a higher percentage of vaccinated individuals died from COVID-19 compared to unvaccinated individuals. This initially seemed counterintuitive and raised questions about the efficacy of vaccines. However, this was another instance of Simpson’s Paradox.
The vaccinated population tended to be older and had more underlying health conditions, both of which are risk factors for severe COVID-19 outcomes. When adjusting for age and health status, it was evident that vaccinated individuals had a significantly lower risk of dying from COVID-19 compared to their unvaccinated counterparts. This example underscores the necessity of considering confounding variables to draw accurate conclusions from data.
How Does Simpson’s Paradox Occur?
Simpson’s Paradox typically arises due to a confounding variable affecting the relationship between the primary variables of interest. This confounding variable can create a misleading picture when data is aggregated. Here are some key reasons why Simpson’s Paradox occurs:
- Omitted Variable Bias: If not accounted for, the confounder can distort the observed relationship between the primary variables.
- Aggregation of Data: Combining data from different groups without considering group-specific characteristics can lead to erroneous conclusions.
- Differential Group Sizes: Differences in group sizes can skew aggregated results, making it essential to analyze subgroups separately.
Also Read: What is Data Analytics? How to Use it in Your Career?
Use Cases
Let’s look at some use cases of Simpson’s Paradox. These cases demonstrate why examining data from multiple perspectives is crucial. The overall numbers don’t always tell the full story.
Medical Trials: The Tricky Drug
A new pain relief drug shows:
- Overall success rate: 60%
- Placebo success rate: 50%
Looks promising. But closer inspection reveals:
- Young adults: Drug 80%, Placebo 70%
- Middle-aged: Drug 60%, Placebo 50%
- Seniors: Drug 40%, Placebo 30%
The drug is 10% more effective in each group, not just overall. This discrepancy occurred because more seniors were in the trial, lowering the average. Without this analysis, we’d miss its effectiveness for younger groups.
Voting: The Popular Vote Puzzle
Scenario:
- Purple Party wins 90% in states with 1 million voters
- Orange Party wins 51% in states with 10 million voters
Final tally:
- Purple: 9 million votes
- Orange: 51 million votes
If each state is worth one “point,” Purple could win more states and the election despite fewer total votes.
For instance, in 2016, Clinton received 2.9 million more votes than Trump overall, yet Trump won more states and the presidency.
These cases demonstrate why examining data from multiple perspectives is crucial. The overall numbers don’t always tell the full story.
Also Read: Step-by-Step Exploratory Data Analysis (EDA) using Python
Avoiding Simpson’s Paradox in Data Analysis
Don’t let Simpson’s Paradox fool you! Here’s what to do:
- Break it down: Don’t just look at the big picture. Dive into the smaller groups to see what’s going on.
- Watch out for troublemakers: Some factors can mess up your results without you knowing. Find them and deal with them.
- Sort it out: Put your data into neat piles. Compare apples to apples, not apples to oranges.
Remember, the devil’s in the details. Follow these tips, and you’ll be a data detective in no time!
Conclusion
Simpson’s Paradox shows us how tricky data can be. It’s like a magic trick that reminds us to look closer. Don’t just trust the big picture—dig into the details. It tells us to watch out for hidden factors that might change everything. We can avoid jumping to wrong conclusions by keeping this paradox in mind. It helps us see what’s going on in our data, not just what it looks like at first glance.
Read more about the Simpson’s Paradox here – Stanford Research
Frequently Asked Questions
Q1. What is Simpson’s paradox in simple terms?
Ans. Simpson’s paradox occurs when a trend in separate groups reverses when the data is combined. It’s like seeing apples win in one basket and oranges in another, but bananas are suddenly on top when you mix all fruits. It shows how grouping data can change conclusions.
Q2. How do you find Simpson’s paradox?
Ans. To spot Simpson’s paradox, compare trends in subgroups to the overall trend. Look for reversals or significant changes when data is combined or split. Analyze data at different levels and watch for inconsistencies. Be aware of group sizes and potential hidden variables that might influence results.
Q3. What is Simpson’s paradox, and how do we avoid falling for it?
Ans. Simpson’s paradox is when grouped data shows one trend, but the combined data shows another. To avoid it, always examine data at multiple levels. Consider confounding variables and group sizes. Don’t rush to conclusions based on aggregated data alone. Question your assumptions and look for alternative explanations.
Q4. What is the logic of Simpson’s paradox?
Ans. The logic behind Simpson’s paradox lies in how data is distributed and combined. Unequal group sizes or overlooked variables can skew overall results. It shows that relationships between variables can change depending on how we slice the data. This paradox reminds us that context matters in data interpretation.
Hello, I am Nitika, a tech-savvy Content Creator and Marketer. Creativity and learning new things come naturally to me. I have expertise in creating result-driven content strategies. I am well versed in SEO Management, Keyword Operations, Web Content Writing, Communication, Content Strategy, Editing, and Writing.


