Introduction
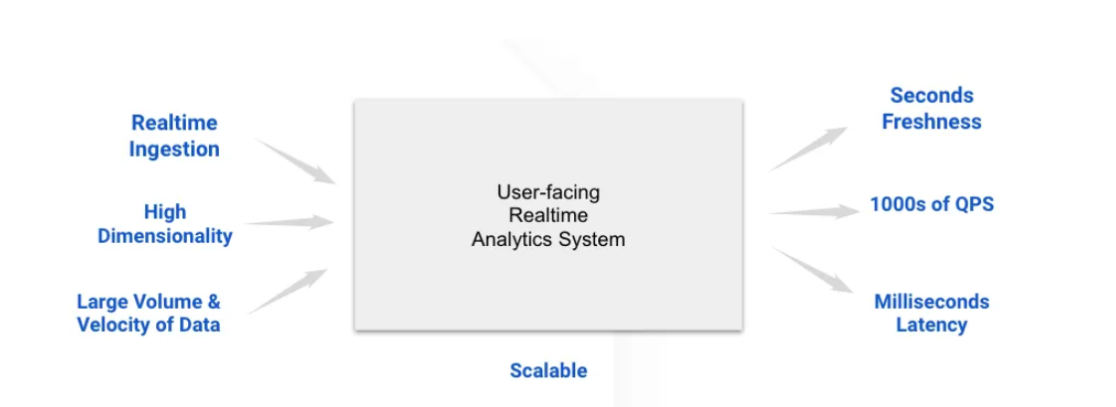
In today’s fast-paced software development environment, ensuring optimal application performance is crucial. Monitoring real-time metrics such as response times, error rates, and resource utilization can help maintain high availability and deliver a seamless user experience. Apache Pinot, an open-source OLAP datastore, offers the ability to handle real-time data ingestion and low-latency querying, making it a suitable solution for monitoring application performance at scale. In this article, we’ll explore how to implement a real-time monitoring system using Apache Pinot, with a focus on setting up Kafka for data streaming, defining Pinot schemas and tables, querying performance data with Python, and visualizing metrics with tools like Grafana.
Learning Objectives
- Learn how Apache Pinot can be used to build a real-time monitoring system for tracking application performance metrics in a distributed environment.
- Learn how to write and execute SQL queries in Python to retrieve and analyze real-time performance metrics from Apache Pinot.
- Gain hands-on experience in setting up Apache Pinot, defining schemas, and configuring tables to ingest and store application metrics data in real-time from Kafka.
- Understand how to integrate Apache Pinot with visualization tools like Grafana or Apache Superset.
This article was published as a part of the Data Science Blogathon.
Table of contents
- Use Case: Real-time Application Performance Monitoring
- Setting Up Kafka for Real-Time Data Streaming
- Creating Kafka Topics
- Defining Pinot Schema and Table Configuration
- Deploying the Schema and Table Configuration
- Querying Data to Monitor KPIs
- Visualizing the Data: Integrating Pinot with Grafana
- Advanced Considerations
- Frequently Asked Questions
Use Case: Real-time Application Performance Monitoring
Let’s explore a scenario where we ’re managing a distributed application serving millions of users across multiple regions. To maintain optimal performance, we need to monitor various performance metrics:
- Response Times– How quickly our application responds to user requests.
- Error Rates: The frequency of errors in your application.
- CPU and Memory Usage: The resources your application is consuming.
Deploy Apache Pinot to create a real-time monitoring system that ingests, stores, and queries performance data, enabling quick detection and response to issues.
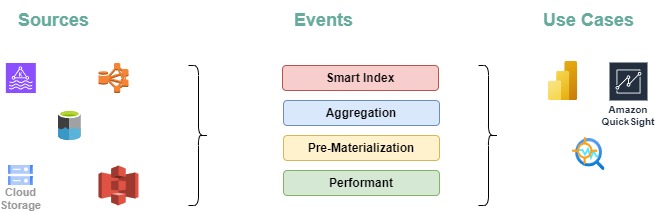
System Architecture
- Data Sources:
- Metrics and logs are collected from different application services.
- These logs are streamed to Apache Kafka for real-time ingestion.
- Data Ingestion:
- Apache Pinot ingests this data directly from Kafka topics, providing real-time processing with minimal delay.
- Pinot stores the data in a columnar format, optimized for fast querying and efficient storage.
- Querying:
- Pinot acts as the query engine, allowing you to run complex queries against real-time data to gain insights into application performance.
- Pinot’s distributed architecture ensures that queries are executed quickly, even as the volume of data grows.
- Visualization:
- The results from Pinot queries can be visualized in real-time using tools like Grafana or Apache Superset, offering dynamic dashboards for monitoring KPI’s.
- Visualization is key to making the data actionable, allowing you to monitor KPIs, set alerts, and respond to issues in real-time.
Setting Up Kafka for Real-Time Data Streaming
The first step is to set up Apache Kafka to handle real-time streaming of our application’s logs and metrics. Kafka is a distributed streaming platform that allows us to publish and subscribe to streams of records in real-time. Each microservice in our application can produce log messages or metrics to Kafka topics, which Pinot will later consume
Install Java
To run Kafka, we will be installing Java on our system-
sudo apt install openjdk-11-jre-headless -y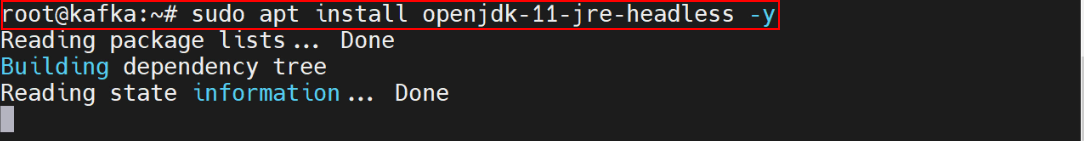
Verify the Java Version
java –version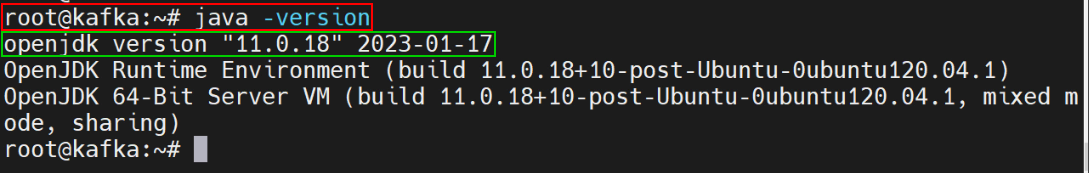
Downloading Kafka
wget https://downloads.apache.org/kafka/3.4.0/kafka_2.13-3.4.0.tgzExtracting the Binaries
sudo mkdir /usr/local/kafka-server
sudo tar xzf kafka_2.13-3.4.0.tgz
Also we need to move the extracted files to the folder given below-
sudo mv kafka_2.13-3.4.0/* /usr/local/kafka-server

Reset the Configuration Files by the Command
sudo systemctl daemon-reloadStarting Kafka
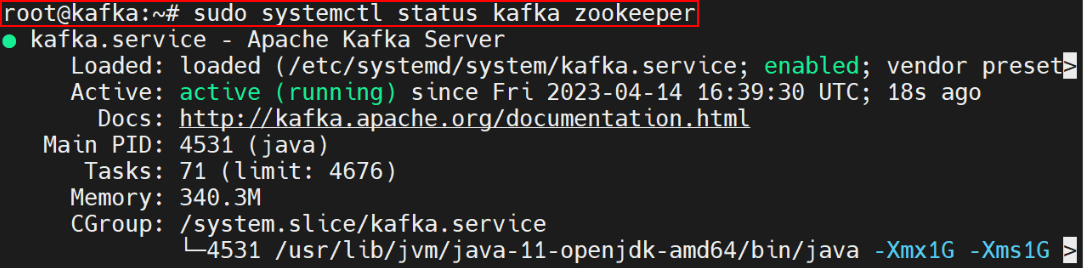
Assuming Kafka and Zookeeper are already installed, Kafka can be started using below commands:
# Start Zookeeper
zookeeper-server-start.sh config/zookeeper.properties

# Start Kafka server
kafka-server-start.sh config/server.properties
Creating Kafka Topics
Next, creation of a Kafka topic for our application metrics. Topics are the channels through which data flows in Kafka. Here, we’ve created a topic named app-metrics with 3 partitions and a replication factor of 1. The number of partitions distributes the data across Kafka brokers, while the replication factor controls the level of redundancy by determining how many copies of the data exist.
kafka-topics.sh --create --topic app-metrics --bootstrap-server localhost:9092 --partitions 3 --replication-factor 1Publishing Data to Kafka
Our application can publish metrics to the Kafka topic in real-time. This script simulates sending application metrics to the Kafka topic every second. The metrics include details such as service name, endpoint, status code, response time, CPU usage, memory usage, and timestamp.
from confluent_kafka import Producer
import json
import time

# Kafka producer configuration
conf = {'bootstrap.servers': "localhost:9092"}
producer = Producer(**conf)

# Function to send a message to Kafka
def send_metrics():
    metrics = {
        "service_name": "auth-service",
        "endpoint": "/login",
        "status_code": 200,
        "response_time_ms": 123.45,
        "cpu_usage": 55.2,
        "memory_usage": 1024.7,
        "timestamp": int(time.time() * 1000)
    }
    producer.produce('app-metrics', value=json.dumps(metrics))
    producer.flush()

# Simulate sending metrics every 2 seconds
while True:
    send_metrics()
    time.sleep(2)
Defining Pinot Schema and Table Configuration
With Kafka set up and streaming data, the next step is to configure Apache Pinot to ingest and store this data. This involves defining a schema and creating a table in Pinot.
Schema Definition
The schema defines the structure of the data that Pinot will ingest. It specifies the dimensions (attributes) and metrics (measurable quantities) that will be stored, as well as the data types for each field. Create a JSON file named “app_performance_ms_schema.json” with the following content:
{
  "schemaName": "app_performance_ms",
  "dimensionFieldSpecs": [
    {"name": "service", "dataType": "STRING"},
    {"name": "endpoint", "dataType": "STRING"},
    {"name": "s_code", "dataType": "INT"}
  ],
  "metricFieldSpecs": [
    {"name": "response_time", "dataType": "DOUBLE"},
    {"name": "cpu_usage", "dataType": "DOUBLE"},
    {"name": "memory_usage", "dataType": "DOUBLE"}
  ],
  "dateTimeFieldSpecs": [
    {
      "name": "timestamp",
      "dataType": "LONG",
      "format": "1:MILLISECONDS:EPOCH",
      "granularity": "1:MILLISECONDS"
    }
  ]
}
Table Configuration
The table configuration file tells Pinot how to manage the data, including details on data ingestion from Kafka, indexing strategies, and retention policies.
Create another JSON file named “app_performance_metrics_table.json” with the following content:
{
  "tableName": "appPerformanceMetrics",
  "tableType": "REALTIME",
  "segmentsConfig": {
    "timeColumnName": "timestamp",
    "schemaName": "appMetrics",
    "replication": "1"
  },
  "tableIndexConfig": {
    "loadMode": "MMAP",
    "streamConfigs": {
      "streamType": "kafka",
      "stream.kafka.topic.name": "app_performance_metrics",
      "stream.kafka.broker.list": "localhost:9092",
      "stream.kafka.consumer.type": "lowlevel"
    }
  }
}
This configuration specifies that the table will ingest data from the app_performance_metrics Kafka topic in real-time. It uses the timestamp column as the primary time column and configures indexing to support efficient queries.
Deploying the Schema and Table Configuration
Once the schema and table configuration are ready, we can deploy them to Pinot using the following commands:
bin/pinot-admin.sh AddSchema -schemaFile app_performance_ms_schema.json -exec
bin/pinot-admin.sh AddTable -tableConfigFile app_performance_metrics_table.json -schemaFile app_performance_ms_schema.json -exec
After deployment, Apache Pinot will start ingesting data from the Kafka topic app-metrics and making it available for querying.
Querying Data to Monitor KPIs
As Pinot ingests data, you can now start querying it to monitor key performance indicators (KPIs). Pinot supports SQL-like queries, allowing us to retrieve and analyze data quickly. Here’s a Python script that queries the average response time and error rate for each service over the past five minutes:
import requests
import json

# Pinot broker URL
pinot_broker_url = "http://localhost:8099/query/sql"

# SQL query to get average response time and error rate
query = """
SELECT service_name,
       AVG(response_time_ms) AS avg_response_time,
       SUM(CASE WHEN status_code >= 400 THEN 1 ELSE 0 END) / COUNT(*) AS error_rate
FROM appPerformanceMetrics
WHERE timestamp >= ago('PT5M')
GROUP BY service_name
"""

# Execute the query
response = requests.post(pinot_broker_url, data=query, headers={"Content-Type": "application/json"})

if response.status_code == 200:
    result = response.json()
    print(json.dumps(result, indent=4))
else:
    print("Query failed with status code:", response.status_code)
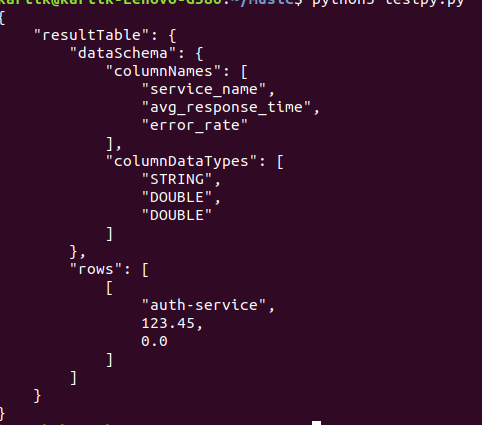
This script sends a SQL query to Pinot to calculate the average response time and error rate for each service in the last five minutes. These metrics are crucial for understanding the real-time performance of our application.
Understanding the Query Results
- Average Response Time: Provides insight into how quickly each service is responding to requests. Higher values might indicate performance bottlenecks.
- Error Rate: Shows the proportion of requests that resulted in errors (status codes >= 400). A high error rate could signal problems with the service.
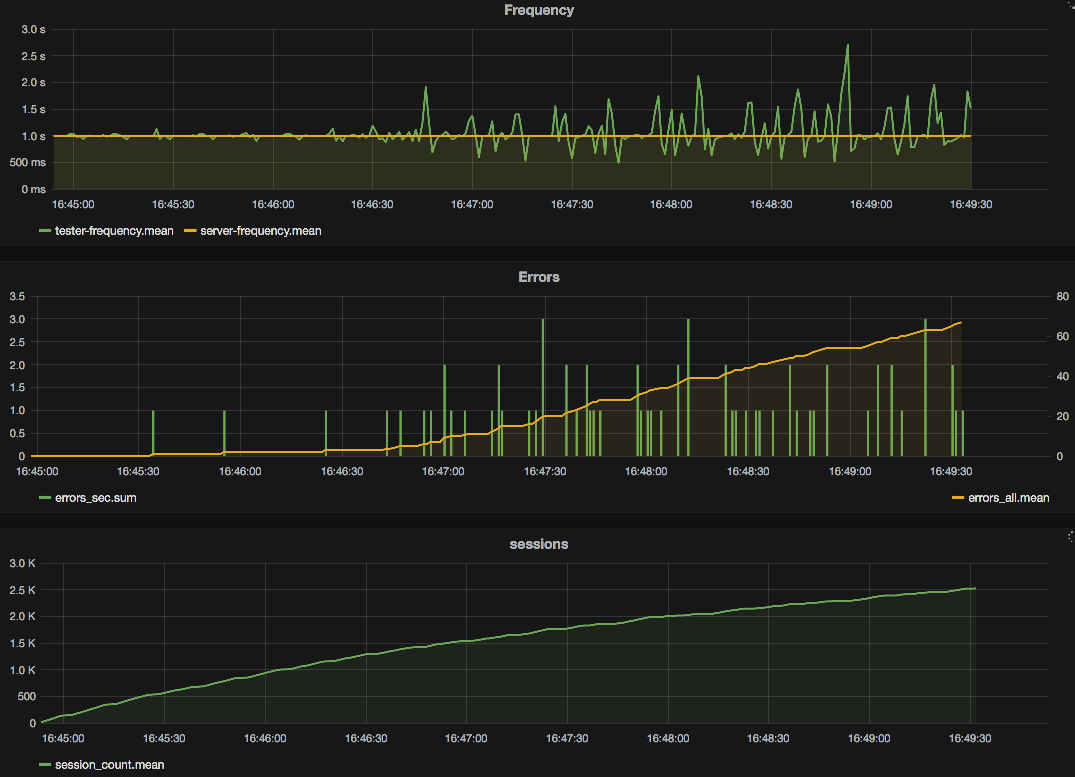
Visualizing the Data: Integrating Pinot with Grafana
Grafana is a popular open-source visualization tool that supports integration with Apache Pinot. By connecting Grafana to Pinot, we can create real-time dashboards that display metrics like response times, error rates, and resource usage. Example dashboard can include the following information-
- Response Times frequency: A line chart with area showing the average response time for each service over the past 24 hours.
- Error Rates: A stacked bar chart highlighting services with high error rates, helping you identify problematic areas quickly.
- Sessions Usage: An area chart displaying CPU and memory usage trends across different services.
This visualization setup provides a comprehensive view of our application’s health and performance, enabling us to monitor KPIs continuously and take proactive measures when issues arise.
Advanced Considerations
As our real-time monitoring system with Apache Pinot expands, there are several advanced aspects to manage for maintaining its effectiveness:
- Data Retention and Archiving:
- Challenge: As your application generates increasing amounts of data, managing storage efficiently becomes crucial to avoid inflated costs and performance slowdowns.
- Solution: Implementing data retention policies helps manage data volume by archiving or deleting older records that are no longer needed for immediate analysis. Apache Pinot automates these processes through its segment management and data retention mechanisms.
- Scaling Pinot:
- Challenge: The growing volume of data and query requests can strain a single Pinot instance or cluster setup.
- Solution: Apache Pinot supports horizontal scaling, enabling you to expand your cluster by adding more nodes. This ensures that the system can handle increased data ingestion and query loads effectively, maintaining performance as your application grows.
- Alerting :
- Challenge: Detecting and responding to performance issues without automated alerts can be challenging, potentially delaying problem resolution.
- Solution: Integrate alerting systems to receive notifications when metrics exceed predefined thresholds. You can use tools like Grafana or Prometheus to set up alerts, ensuring you are promptly informed of any anomalies or issues in your application’s performance.
- Performance Optimization:
- Challenge: With a growing dataset and complex queries, maintaining efficient query performance can become challenging.
- Solution: Continuously optimize your schema design, indexing strategies, and query patterns. Utilize Apache Pinot’s tools to monitor and address performance bottlenecks. Employ partitioning and sharding techniques to better distribute data and queries across the cluster.
Conclusion
Effective real-time monitoring is essential for ensuring the performance and reliability of modern applications. Apache Pinot offers a powerful solution for real-time data processing and querying, making it well-suited for comprehensive monitoring systems. By implementing the strategies discussed and considering advanced topics like scaling and security, you can build a robust and scalable monitoring system that helps you stay ahead of potential performance issues, ensuring a smooth experience for your users.
Key Takeaways
- Apache Pinot is adept at handling real-time data ingestion and provides low-latency query performance, making it a powerful tool for monitoring application performance metrics. It integrates well with streaming platforms like Kafka, enabling immediate analysis of metrics such as response times, error rates, and resource utilization.
- Kafka streams application logs and metrics, which Apache Pinot then ingests. Configuring Kafka topics and linking them with Pinot allows for continuous processing and querying of performance data, ensuring up-to-date insights.
- Properly defining schemas and configuring tables in Apache Pinot is crucial for efficient data management. The schema outlines the data structure and types, while the table configuration controls data ingestion and indexing, supporting effective real-time analysis.
- Apache Pinot supports SQL-like queries for in-depth data analysis. When used with visualization tools such as Grafana or Apache Superset, it enables the creation of dynamic dashboards that provide real-time visibility into application performance, aiding in the swift detection and resolution of issues.
Frequently Asked Questions
Q1. What makes Apache Pinot suitable for real-time application performance monitoring?
A. Apache Pinot is optimized for low-latency querying, making it ideal for scenarios where real-time insights are crucial. Its ability to ingest data from streaming sources like Kafka and handle large-scale, high-throughput data sets allows it to provide up-to-the-minute analytics on application performance metrics.
Q2. How does Apache Pinot handle real-time data ingestion from Kafka?
A. Apache Pinot is designed to ingest real-time data by directly consuming messages from Kafka topics. It supports both low-level and high-level Kafka consumers, allowing Pinot to process and store data with minimal delay, making it available for immediate querying.
Q3. What are the key components needed to set up a real-time monitoring system using Apache Pinot?
A. To set up a real-time monitoring system with Apache Pinot, you need:
Data Sources: Application logs and metrics streamed to Kafka.
Apache Pinot: For real-time data ingestion and querying.
Schema and Table Configuration: Definitions in Pinot for storing and indexing the metrics data.
Visualization Tools: Tools like Grafana or Apache Superset for creating real-time dashboards
Q4. Can I use other data streaming platforms besides Kafka with Apache Pinot?
A. Yes, Apache Pinot supports integration with other data streaming platforms like Apache Pulsar and AWS Kinesis. While this article focuses on Kafka, the same principles apply when using different streaming platforms, though configuration details will vary.
The media shown in this article is not owned by Analytics Vidhya and is used at the Author’s discretion.
Hello World : Myself Kartik Sharma, working as senior data engineer and business analyst for Zensar Technologies Ltd. I am new to blogging and just trying it out for fun. "A techno geek who accidentally fell in love with words."


