In many real-world applications, data is not purely textual—it may include images, tables, and charts that help reinforce the narrative. A multimodal report generator allows you to incorporate both text and images into a final output, making your reports more dynamic and visually rich.
This article outlines how to build such a pipeline using:
- LlamaIndex for orchestrating document parsing and query engines,
- OpenAI language models for textual analysis,
- LlamaParse to extract both text and images from PDF documents,
- An observability setup using Arize Phoenix (via LlamaTrace) for logging and debugging.
The end result is a pipeline that can process an entire PDF slide deck—both text and visuals—and generate a structured report containing both text and images.
Learning Objectives
- Understand how to integrate text and visuals for effective financial report generation using multimodal pipelines.
- Learn to utilize LlamaIndex and LlamaParse for enhanced financial report generation with structured outputs.
- Explore LlamaParse for extracting both text and images from PDF documents effectively.
- Set up observability using Arize Phoenix (via LlamaTrace) for logging and debugging complex pipelines.
- Create a structured query engine to generate reports that interleave text summaries with visual elements.
This article was published as a part of the Data Science Blogathon.
Table of contents
- Overview of the Process
- Step-by-Step Implementation
- Step 1: Install and Import Dependencies
- Step 2: Set Up Observability
- Step 3: Load the data – Obtain Your Slide Deck
- Step 4: Set Up Models
- Step 5: Parse the Document with LlamaParse
- Step 6: Associate Text and Images
- Step 7: Build a Summary Index
- Step 8: Define a Structured Output Schema
- Step 9: Create a Structured Query Engine
- Conclusion
- Frequently Asked Questions
Overview of the Process
Building a multimodal report generator involves creating a pipeline that seamlessly integrates textual and visual elements from complex documents like PDFs. The process starts with installing the necessary libraries, such as LlamaIndex for document parsing and query orchestration, and LlamaParse for extracting both text and images. Observability is established using Arize Phoenix (via LlamaTrace) to monitor and debug the pipeline.
Once the setup is complete, the pipeline processes a PDF document, parsing its content into structured text and rendering visual elements like tables and charts. These parsed elements are then associated, creating a unified dataset. A SummaryIndex is built to enable high-level insights, and a structured query engine is developed to generate reports that blend textual analysis with relevant visuals. The result is a dynamic and interactive report generator that transforms static documents into rich, multimodal outputs tailored for user queries.
Step-by-Step Implementation
Follow this detailed guide to build a multimodal report generator, from setting up dependencies to generating structured outputs with integrated text and images. Each step ensures a seamless integration of LlamaIndex, LlamaParse, and Arize Phoenix for an efficient and dynamic pipeline.
Step 1: Install and Import Dependencies
You’ll need the following libraries running on Python 3.9.9 :
- llama-index
- llama-parse (for text + image parsing)
- llama-index-callbacks-arize-phoenix (for observability/logging)
- nest_asyncio (to handle async event loops in notebooks)
!pip install -U llama-index-callbacks-arize-phoenix

import nest_asyncio

nest_asyncio.apply()
Step 2: Set Up Observability
We integrate with LlamaTrace – LlamaCloud API (Arize Phoenix). First, obtain an API key from llamatrace.com, then set up environment variables to send traces to Phoenix.
Phoenix API key can be obtained by signing up for LlamaTrace here , then navigate to the bottom left panel and click on ‘Keys’ where you should find your API key.
For example:
PHOENIX_API_KEY = "<PHOENIX_API_KEY>"
os.environ["OTEL_EXPORTER_OTLP_HEADERS"] = f"api_key={PHOENIX_API_KEY}"
llama_index.core.set_global_handler(
    "arize_phoenix", endpoint="https://llamatrace.com/v1/traces"
)
Step 3: Load the data – Obtain Your Slide Deck
For demonstration, we use ConocoPhillips’ 2023 investor meeting slide deck. We download the PDF:
import os
import requests

# Create the directories (ignore errors if they already exist)
os.makedirs("data", exist_ok=True)
os.makedirs("data_images", exist_ok=True)

# URL of the PDF
url = "https://static.conocophillips.com/files/2023-conocophillips-aim-presentation.pdf"

# Download and save to data/conocophillips.pdf
response = requests.get(url)
with open("data/conocophillips.pdf", "wb") as f:
    f.write(response.content)

print("PDF downloaded to data/conocophillips.pdf")
Check if the pdf slide deck is in the data folder, if not place it in the data folder and name it as you want.
Step 4: Set Up Models
You need an embedding model and an LLM. In this example:
from llama_index.llms.openai import OpenAI
from llama_index.embeddings.openai import OpenAIEmbedding
embed_model = OpenAIEmbedding(model="text-embedding-3-large")
llm = OpenAI(model="gpt-4o")
Next, you register these as the default for LlamaIndex:
from llama_index.core import Settings
Settings.embed_model = embed_model
Settings.llm = llm
Step 5: Parse the Document with LlamaParse
LlamaParse can extract text and images (via a multimodal large model). For each PDF page, it returns:
- Markdown text (with tables, headings, bullet points, etc.)
- A rendered image (saved locally)
print(f"Parsing slide deck...")
md_json_objs = parser.get_json_result("data/conocophillips.pdf")
md_json_list = md_json_objs[0]["pages"]
print(md_json_list[10]["md"])
print(md_json_list[1].keys())
image_dicts = parser.get_images(md_json_objs, download_path="data_images")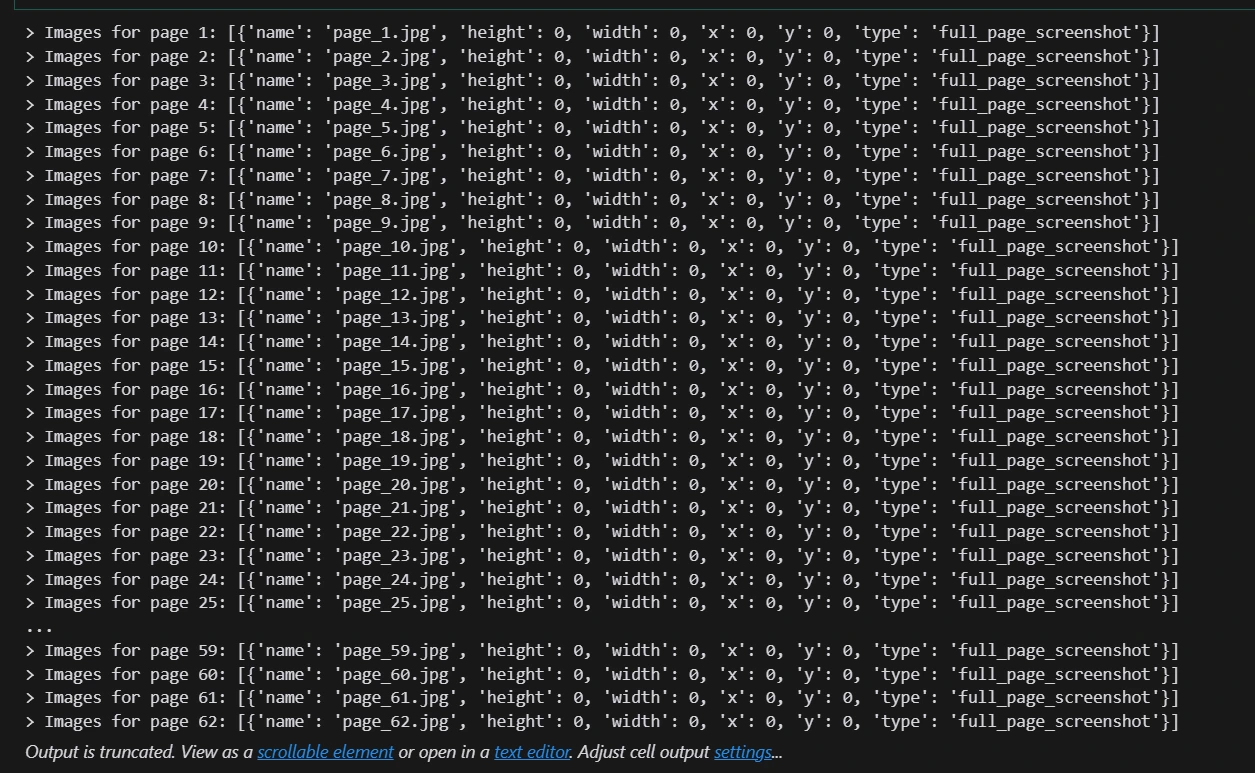
Step 6: Associate Text and Images
We create a list of TextNode objects (LlamaIndex’s data structure) for each page. Each node has metadata about the page number and the corresponding image file path:
from llama_index.core.schema import TextNode
from typing import Optional

# get pages loaded through llamaparse
import re


def get_page_number(file_name):
    match = re.search(r"-page-(\d+)\.jpg$", str(file_name))
    if match:
        return int(match.group(1))
    return 0


def _get_sorted_image_files(image_dir):
    """Get image files sorted by page."""
    raw_files = [f for f in list(Path(image_dir).iterdir()) if f.is_file()]
    sorted_files = sorted(raw_files, key=get_page_number)
    return sorted_files

from copy import deepcopy
from pathlib import Path


# attach image metadata to the text nodes
def get_text_nodes(json_dicts, image_dir=None):
    """Split docs into nodes, by separator."""
    nodes = []

    image_files = _get_sorted_image_files(image_dir) if image_dir is not None else None
    md_texts = [d["md"] for d in json_dicts]

    for idx, md_text in enumerate(md_texts):
        chunk_metadata = {"page_num": idx + 1}
        if image_files is not None:
            image_file = image_files[idx]
            chunk_metadata["image_path"] = str(image_file)
        chunk_metadata["parsed_text_markdown"] = md_text
        node = TextNode(
            text="",
            metadata=chunk_metadata,
        )
        nodes.append(node)

    return nodes

# this will split into pages
text_nodes = get_text_nodes(md_json_list, image_dir="data_images")

print(text_nodes[10].get_content(metadata_mode="all"))
Step 7: Build a Summary Index
With these text nodes in hand, you can create a SummaryIndex:
import os
from llama_index.core import (
    StorageContext,
    SummaryIndex,
    load_index_from_storage,
)

if not os.path.exists("storage_nodes_summary"):
    index = SummaryIndex(text_nodes)
    # save index to disk
    index.set_index_id("summary_index")
    index.storage_context.persist("./storage_nodes_summary")
else:
    # rebuild storage context
    storage_context = StorageContext.from_defaults(persist_dir="storage_nodes_summary")
    # load index
    index = load_index_from_storage(storage_context, index_id="summary_index")
The SummaryIndex ensures you can easily retrieve or generate high-level summaries over the entire document.
Step 8: Define a Structured Output Schema
Our pipeline aims to produce a final output with interleaved text blocks and image blocks. For that, we create a custom Pydantic model (using Pydantic v2 or ensuring compatibility) with two block types—TextBlock and ImageBlock—and a parent model ReportOutput:
from llama_index.llms.openai import OpenAI
from pydantic import BaseModel, Field
from typing import List
from IPython.display import display, Markdown, Image
from typing import Union


class TextBlock(BaseModel):
    """Text block."""

    text: str = Field(..., description="The text for this block.")


class ImageBlock(BaseModel):
    """Image block."""

    file_path: str = Field(..., description="File path to the image.")


class ReportOutput(BaseModel):
    """Data model for a report.

    Can contain a mix of text and image blocks. MUST contain at least one image block.

    """

    blocks: List[Union[TextBlock, ImageBlock]] = Field(
        ..., description="A list of text and image blocks."
    )

    def render(self) -> None:
        """Render as HTML on the page."""
        for b in self.blocks:
            if isinstance(b, TextBlock):
                display(Markdown(b.text))
            else:
                display(Image(filename=b.file_path))


system_prompt = """\
You are a report generation assistant tasked with producing a well-formatted context given parsed context.

You will be given context from one or more reports that take the form of parsed text.

You are responsible for producing a report with interleaving text and images - in the format of interleaving text and "image" blocks.
Since you cannot directly produce an image, the image block takes in a file path - you should write in the file path of the image instead.

How do you know which image to generate? Each context chunk will contain metadata including an image render of the source chunk, given as a file path.
Include ONLY the images from the chunks that have heavy visual elements (you can get a hint of this if the parsed text contains a lot of tables).
You MUST include at least one image block in the output.

You MUST output your response as a tool call in order to adhere to the required output format. Do NOT give back normal text.

"""


llm = OpenAI(model="gpt-4o", api_key="OpenAI_API_KEY", system_prompt=system_prompt)
sllm = llm.as_structured_llm(output_cls=ReportOutput)
The key point: ReportOutput requires at least one image block, ensuring the final answer is multimodal.
Step 9: Create a Structured Query Engine
LlamaIndex allows you to use a “structured LLM” (i.e., an LLM whose output is automatically parsed into a specific schema). Here’s how:
query_engine = index.as_query_engine(
    similarity_top_k=10,
    llm=sllm,
    # response_mode="tree_summarize"
    response_mode="compact",
)

response = query_engine.query(
    "Give me a summary of the financial performance of the Alaska/International segment vs. the lower 48 segment"
)

response.response.render()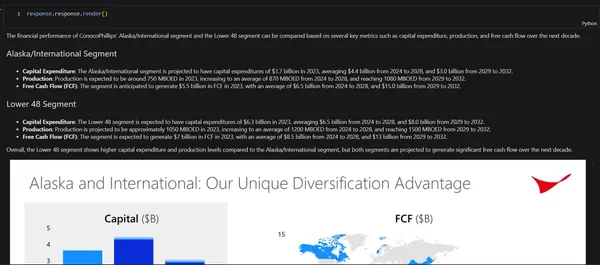
# Output
The financial performance of ConocoPhillips' Alaska/International segment and the Lower 48 segment can be compared based on several key metrics such as capital expenditure, production, and free cash flow over the next decade.

Alaska/International Segment
Capital Expenditure: The Alaska/International segment is projected to have capital expenditures of $3.7 billion in 2023, averaging $4.4 billion from 2024 to 2028, and $3.0 billion from 2029 to 2032.
Production: Production is expected to be around 750 MBOED in 2023, increasing to an average of 870 MBOED from 2024 to 2028, and reaching 1080 MBOED from 2029 to 2032.
Free Cash Flow (FCF): The segment is anticipated to generate $5.5 billion in FCF in 2023, with an average of $6.5 billion from 2024 to 2028, and $15.0 billion from 2029 to 2032.
Lower 48 Segment
Capital Expenditure: The Lower 48 segment is expected to have capital expenditures of $6.3 billion in 2023, averaging $6.5 billion from 2024 to 2028, and $8.0 billion from 2029 to 2032.
Production: Production is projected to be approximately 1050 MBOED in 2023, increasing to an average of 1200 MBOED from 2024 to 2028, and reaching 1500 MBOED from 2029 to 2032.
Free Cash Flow (FCF): The segment is expected to generate $7 billion in FCF in 2023, with an average of $8.5 billion from 2024 to 2028, and $13 billion from 2029 to 2032.
Overall, the Lower 48 segment shows higher capital expenditure and production levels compared to the Alaska/International segment, but both segments are projected to generate significant free cash flow over the next decade.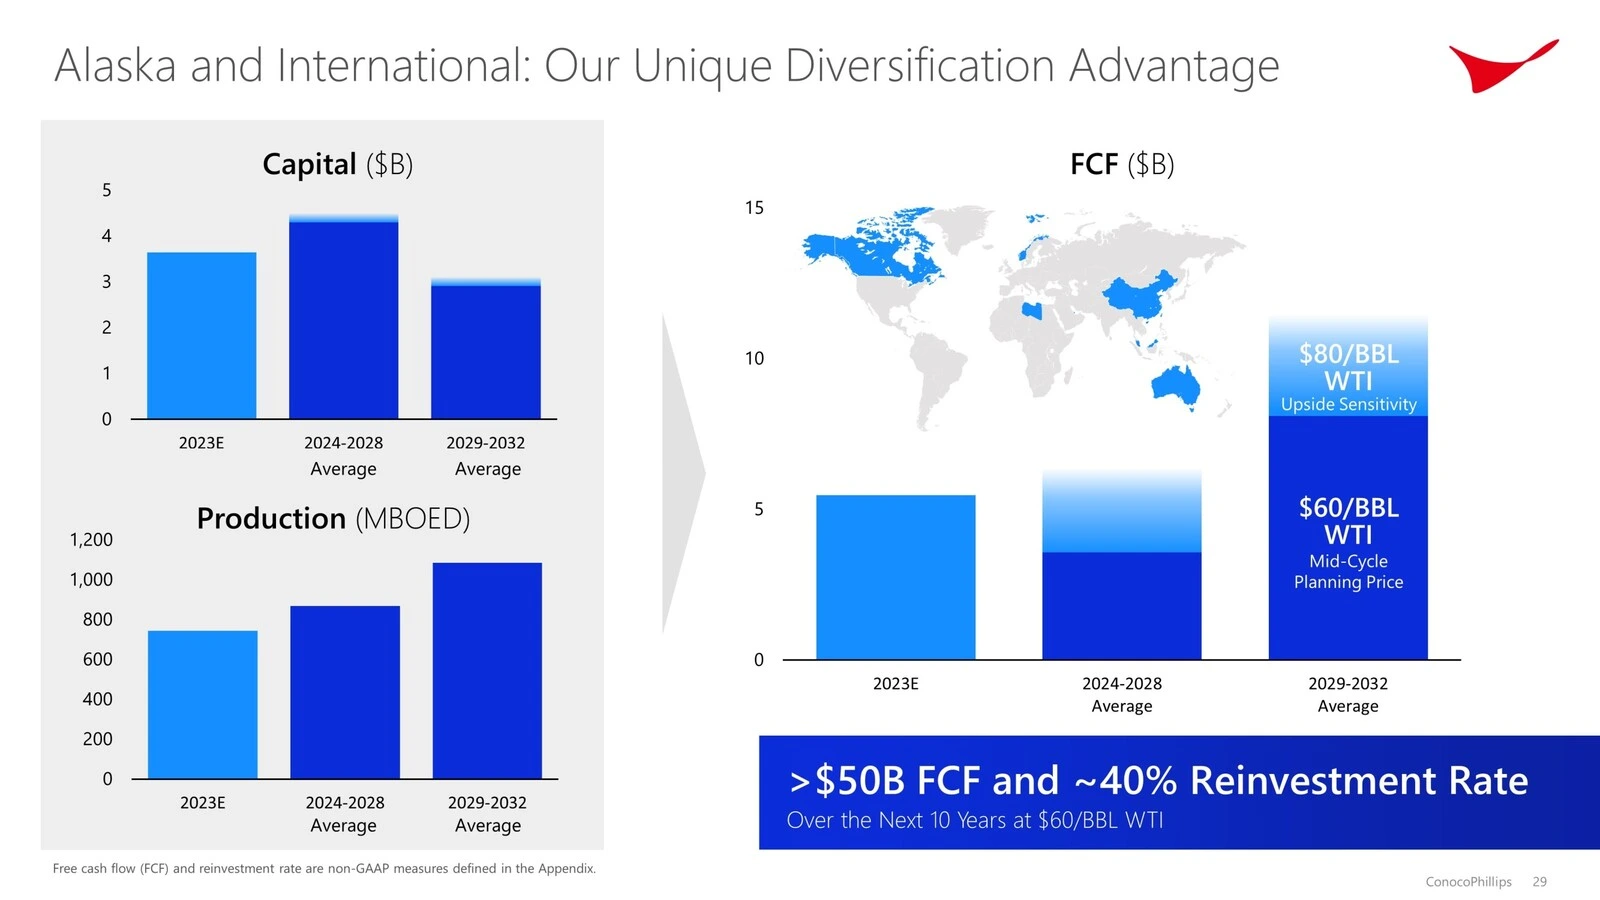
# Trying another query
response = query_engine.query(
    "Give me a summary of whether you think the financial projections are stable, and if not, what are the potential risk factors. "
    "Support your research with sources."
)

response.response.render()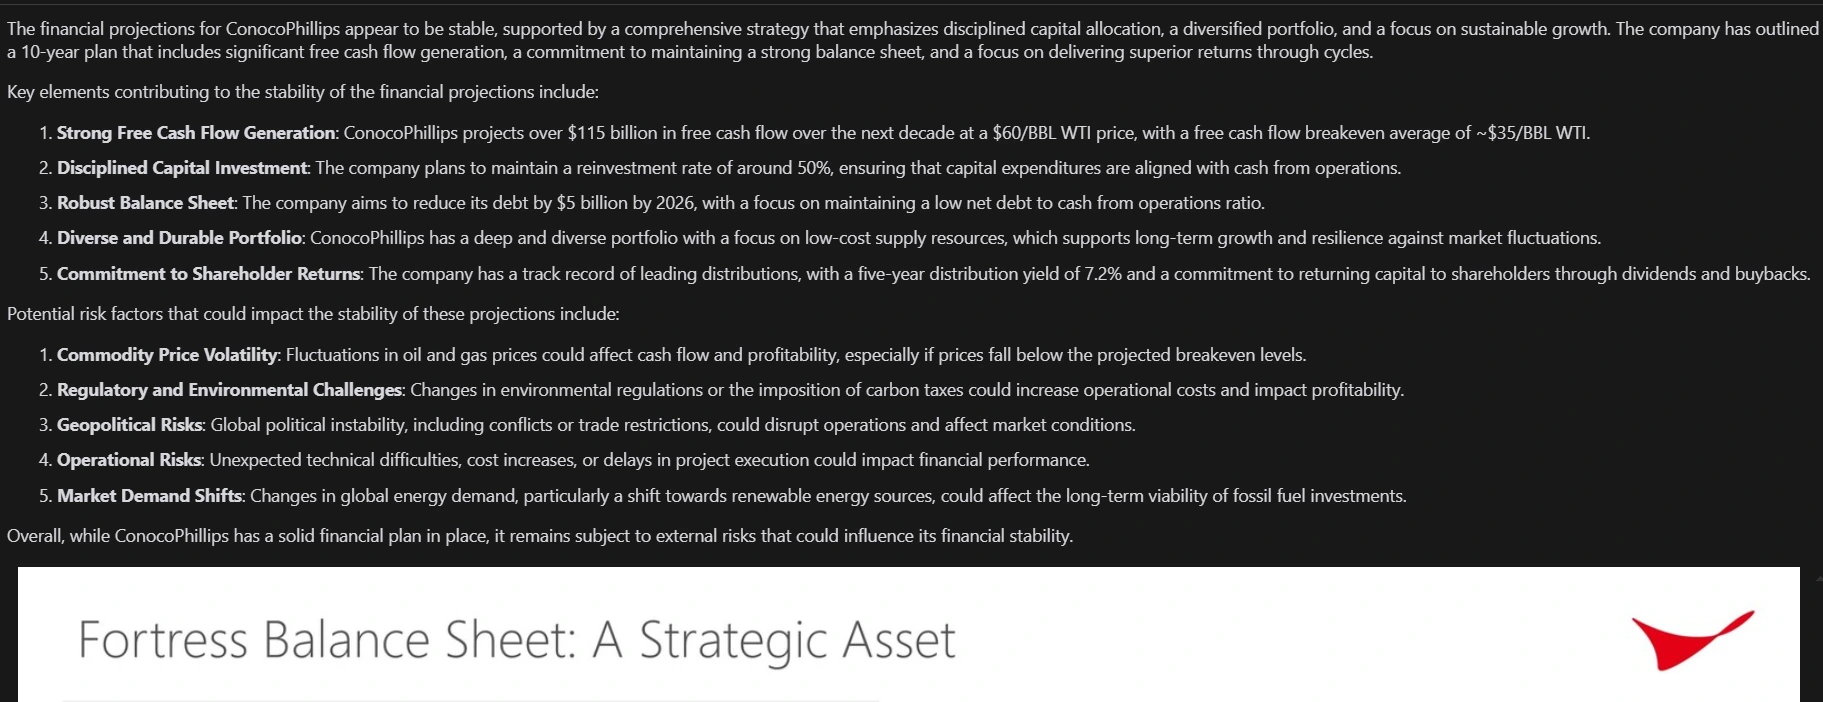
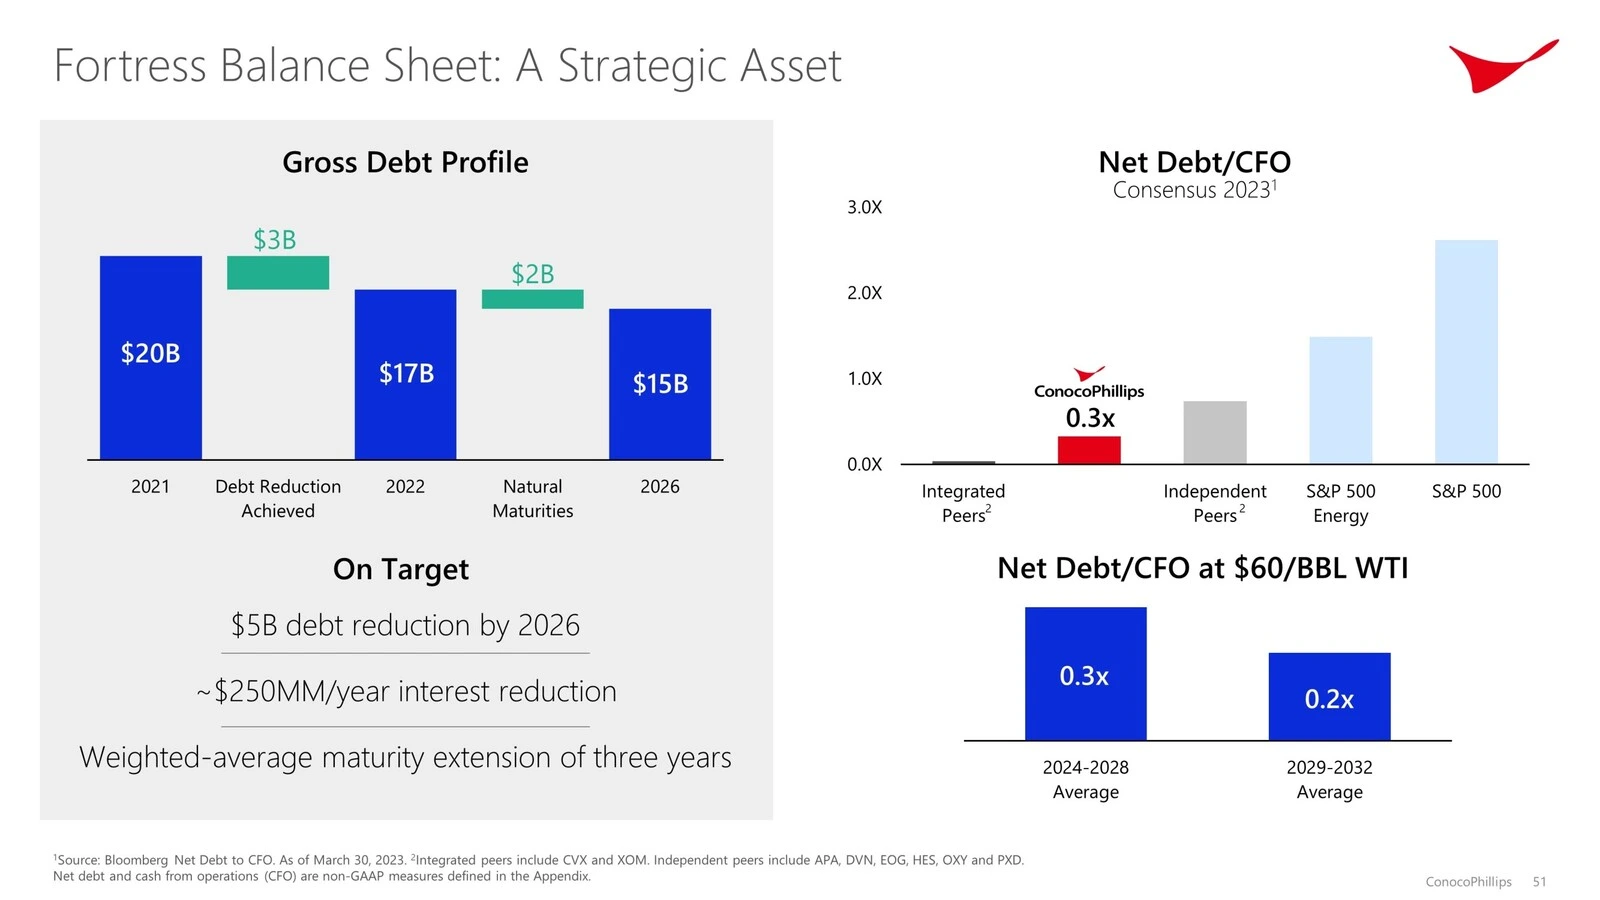
Conclusion
By combining LlamaIndex, LlamaParse, and OpenAI, you can build a multimodal report generator that processes an entire PDF (with text, tables, and images) into a structured output. This approach delivers richer, more visually informative results—exactly what stakeholders need to glean critical insights from complex corporate or technical documents.
Feel free to adapt this pipeline to your own documents, add a retrieval step for large archives, or integrate domain-specific models for analyzing the underlying images. With the foundations laid out here, you can create dynamic, interactive, and visually rich reports that go far beyond simple text-based queries.
A big thanks to Jerry Liu from LlamaIndex for developing this amazing pipeline.
Key Takeaways
- Transform PDFs with text and visuals into structured formats while preserving the integrity of original content using LlamaParse and LlamaIndex.
- Generate visually enriched reports that interweave textual summaries and images for better contextual understanding.
- Financial report generation can be enhanced by integrating both text and visual elements for more insightful and dynamic outputs.
- Leveraging LlamaIndex and LlamaParse streamlines the process of financial report generation, ensuring accurate and structured results.
- Retrieve relevant documents before processing to optimize report generation for large archives.
- Improve visual parsing, incorporate chart-specific analytics, and combine models for text and image processing for deeper insights.
Frequently Asked Questions
A. A multimodal report generator is a system that produces reports containing multiple types of content—primarily text and images—in one cohesive output. In this pipeline, you parse a PDF into both textual and visual elements, then combine them into a single final report.
A. Observability tools like Arize Phoenix (via LlamaTrace) let you monitor and debug model behavior, track queries and responses, and identify issues in real time. It’s especially useful when dealing with large or complex documents and multiple LLM-based steps.
A. Most PDF text extractors only handle raw text, often losing formatting, images, and tables. LlamaParse is capable of extracting both text and images (rendered page images), which is crucial for building multimodal pipelines where you need to refer back to tables, charts, or other visuals.
A. SummaryIndex is a LlamaIndex abstraction that organizes your content (e.g., pages of a PDF) so it can quickly generate comprehensive summaries. It helps gather high-level insights from long documents without having to chunk them manually or run a retrieval query for each piece of data.
A. In the ReportOutput Pydantic model, enforce that the blocks list requires at least one ImageBlock. This is stated in your system prompt and schema. The LLM must follow these rules, or it will not produce valid structured output.
The media shown in this article is not owned by Analytics Vidhya and is used at the Author’s discretion.
