yFiles is a powerful SDK designed to simplify the visualization of complex networks and data relationships. When combined with LlamaIndex, it becomes a powerful tool for visualizing and interacting with knowledge graphs in real time. This guide walks you through the integration process, highlights essential steps, and demonstrates key features for an impactful, useful and interpretable Generative AI application.
Learning Objectives
- Enabling LLM development through knowledge graph visualization
- Discover how to empower LLM development through effective knowledge graph visualization.
- Learn to leverage yFiles for intuitive, interactive diagrams that simplify debugging and optimization in AI applications.
This article was published as a part of the Data Science Blogathon.
Table of contents
Integrating Knowledge Graphs: A Developer’s Visualization Solution
Knowledge graphs are fundamental for building intelligent AI applications, particularly those powered by large language models. They enable rapid and precise information retrieval, which is crucial for generating contextually relevant responses.
A key challenge for AI developers is visualizing these graphs in a way that aligns with their existing technical infrastructure. Many projects utilize front-end frameworks like React, Angular, or Vue, alongside AI libraries such as LlamaIndex, LangChain, or Haystack. yFiles addresses this by offering a client-side TypeScript SDK that integrates seamlessly into these environments, facilitating efficient knowledge graph visualization.
yFiles’ versatility allows it to handle data from diverse sources, as anything can be converted into visual representations of nodes and edges. This capability streamlines the process of integrating data from multiple pipelines, microservices, or document uploads, providing a unified and interactive view of complex information.
Installation
For detailed installation steps, refer to the following resources:
- yWorks Blog – Empowering LLM Development with Visualizing Knowledge Graphs
- GitHub Repository – yfiles-graph-for-create-llama
Obtain yFiles for HTML
To use yFiles, you will need to obtain a free evaluation package from yWorks. Follow these steps:
- Go to the yWorks Evaluation Portal.
- Create an account or log in.
- Download the evaluation version of yFiles for HTML.
- Follow the instructions provided by yWorks to obtain your evaluation license key.
Note: The files that you download will have the package.json , in which a key named “license” will have your license that you can save in your .env file in the backend folder along with the OpenAI API key.
However, here’s a quick overview of the installation process:
Step 1: Clone the Repository
git clone https://github.com/yWorks/yfiles-graph-for-create-llama.git
cd yfiles-graph-for-create-llama
Step 2: Install Dependencies
Follow the steps mentioned in the GitHub repo to set up the environment files and other requirements. Then begin with installing and setting up the dependencies.
1. Frontend
cd frontend
npm install
2. Backend
cd ../backend
poetry install
Step 3: Configure .env Files
Create a .env file in both the frontend and backend directories:
Frontend .env
BACKEND_URL=http://localhost:8000Backend .env
OPENAI_API_KEY=your_openai_key_here
YFILES_LICENSE=your_yfiles_license_here
APP_HOST=0.0.0.0
APP_PORT=8000
Step 4: Run the Project
1. Start the Backend
cd backend
poetry run python main.py
2. Start the Frontend
cd ../frontend
npm run dev
3. Visit http://localhost:3000 to see the application in action.
Features and Demonstrations of yFiles
1. Dynamic Knowledge Graph Visualization
yFiles seamlessly integrates into the UI by dynamically visualizing data retrieved from the backend’s LlamaIndex-powered knowledge graph. Each node represents key information, and relationships are visualized through connecting edges.
- Nodes and edges auto-adjust their layout for improved clarity.
- Graphs dynamically expand to reveal deeper connections.
2. Real-time Graph Updates
When querying the chatbot interface, yFiles dynamically expands and highlights active nodes, providing visual insights into the graph structure.
- Real-time updates as data flows through the system.
- Highlights nodes during active interactions.
3. Interactive Node Exploration
yFiles makes exploring knowledge graphs intuitive. Double-clicking on a node reveals its neighbouring nodes, making it easier to explore complex data networks.
- Expandable nodes for better exploration.
- Focus on critical information without cluttering the UI.
4. Data-driven Coloring and Styling
Using yFiles’ extensive API, developers can:
- Assign specific colours to nodes based on category.
- Highlight important nodes for enhanced visibility.
5. Automatic Graph Layouts
yFiles comes with various layout algorithms that automatically position nodes and edges in an optimal structure, improving readability for large graphs.
- Circular, hierarchical, and organic layout algorithms.
- Customizable styling for improved UX.
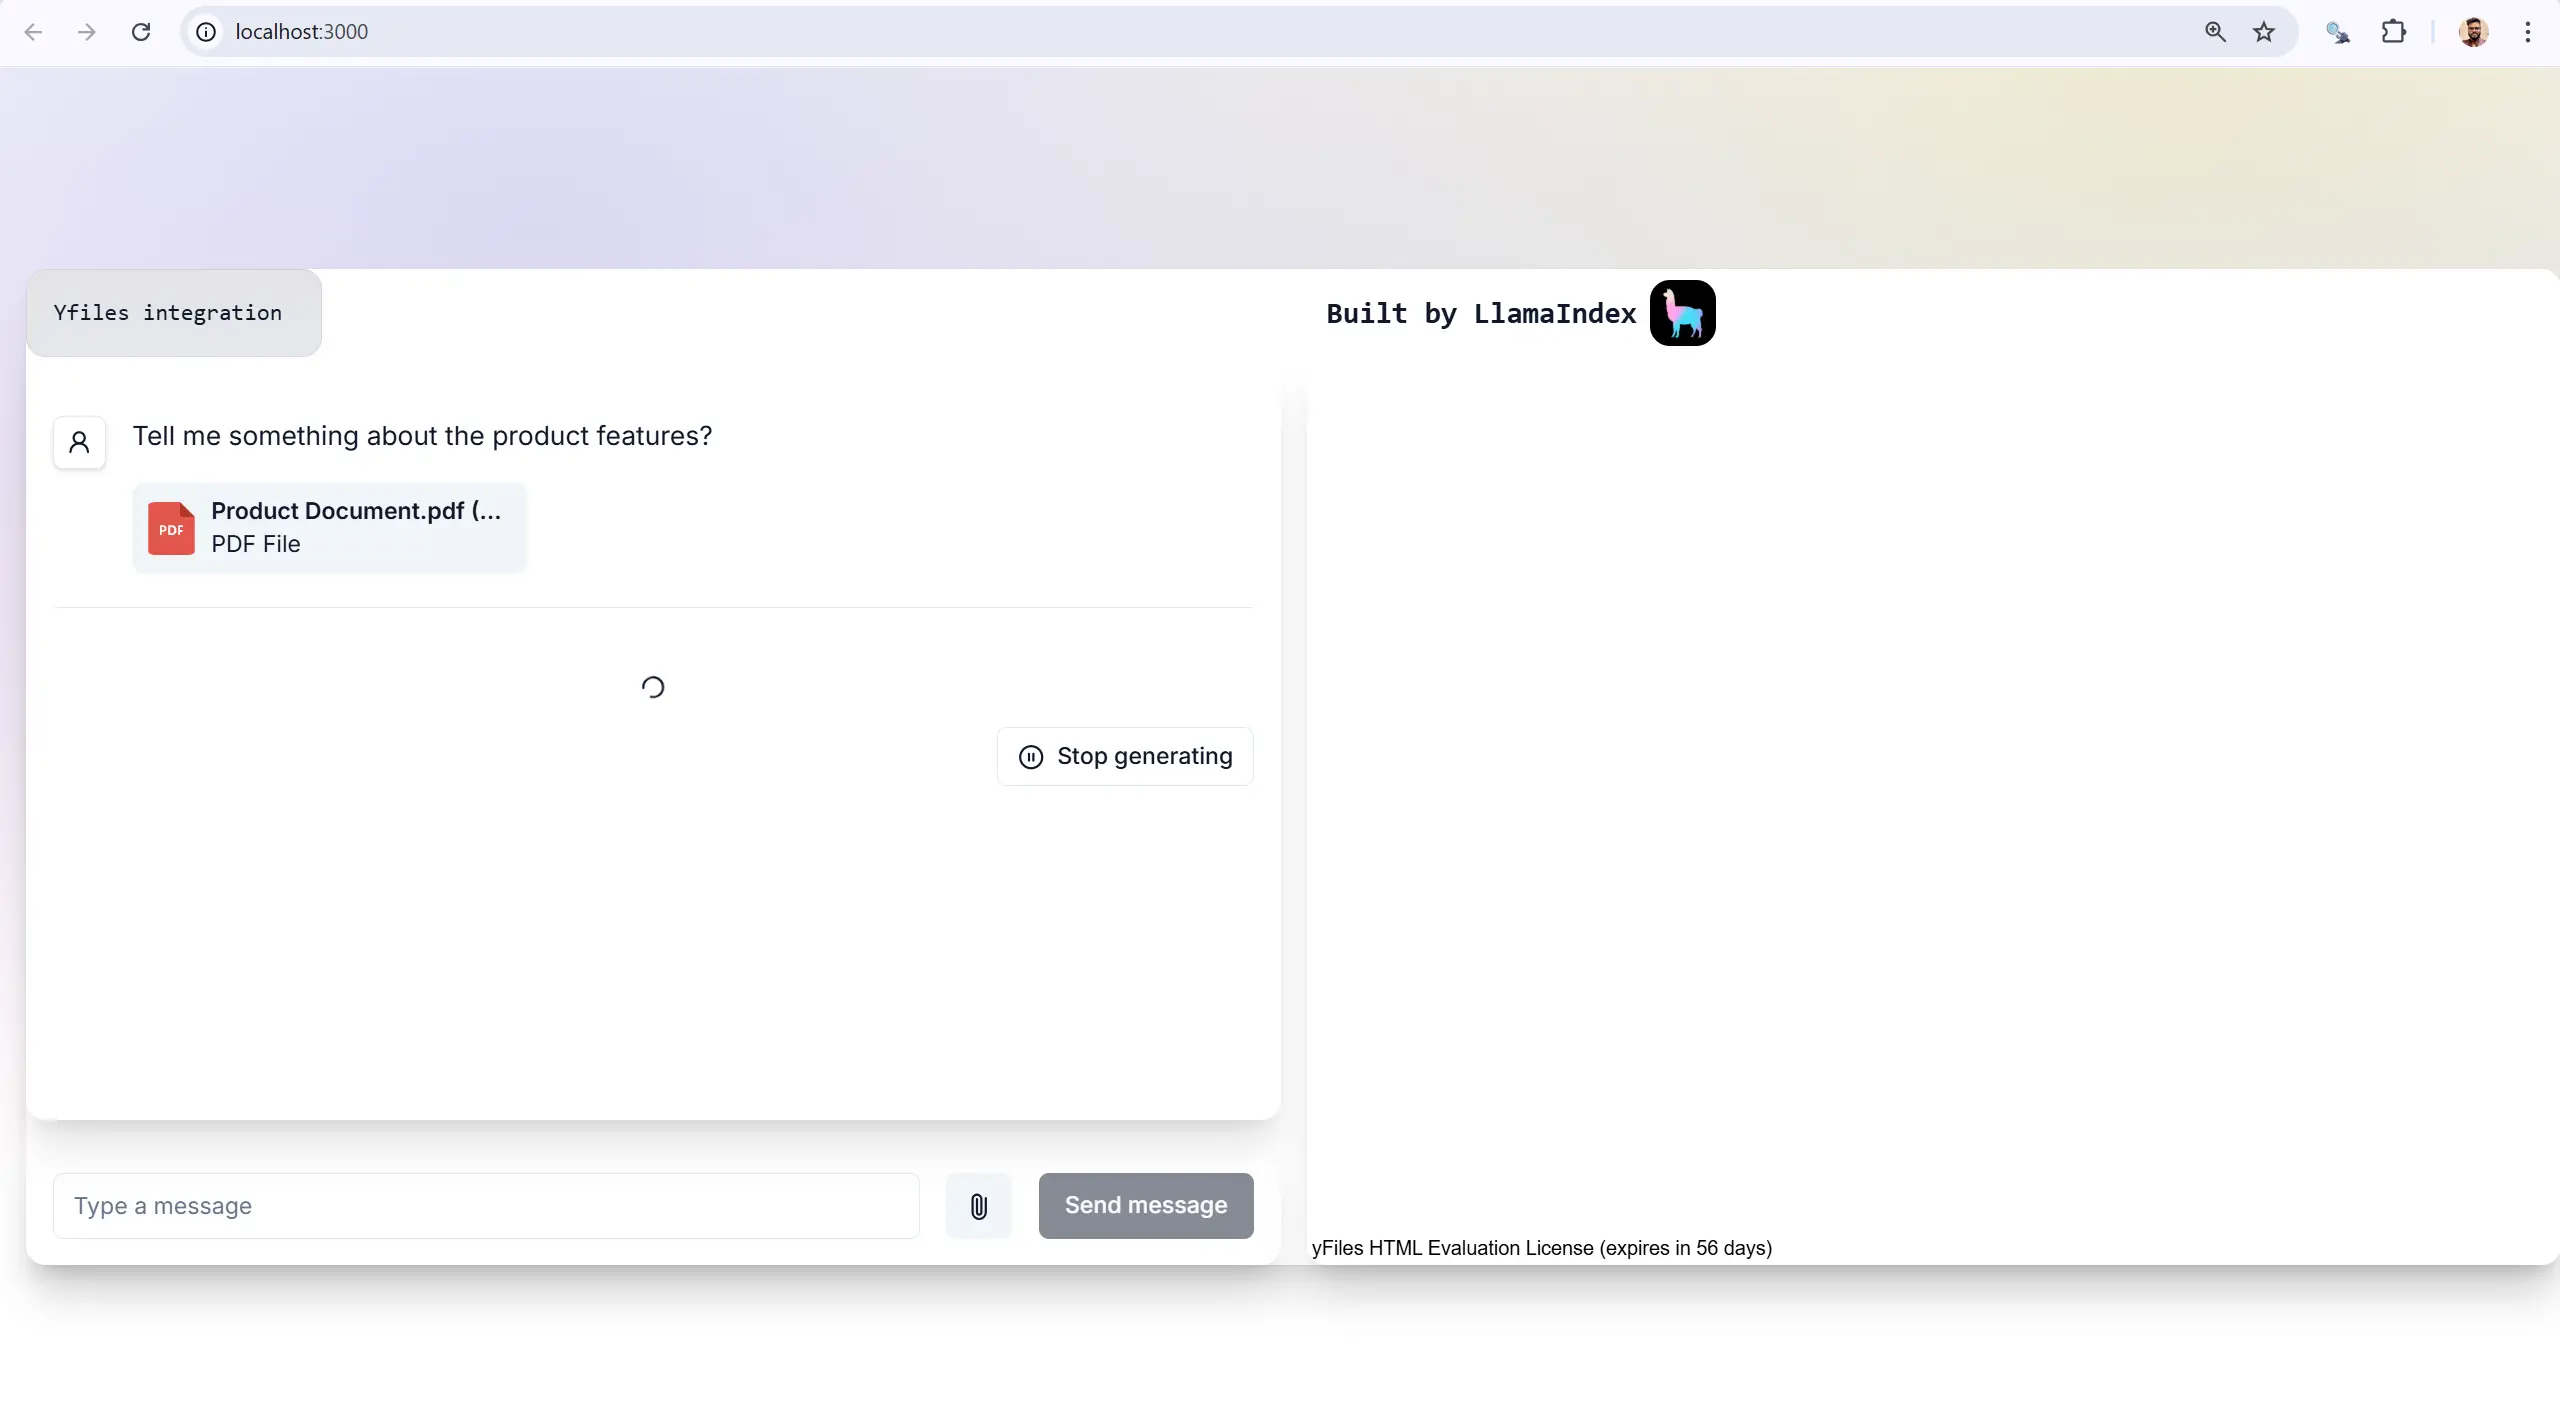
Here I am uploading a Product Document.
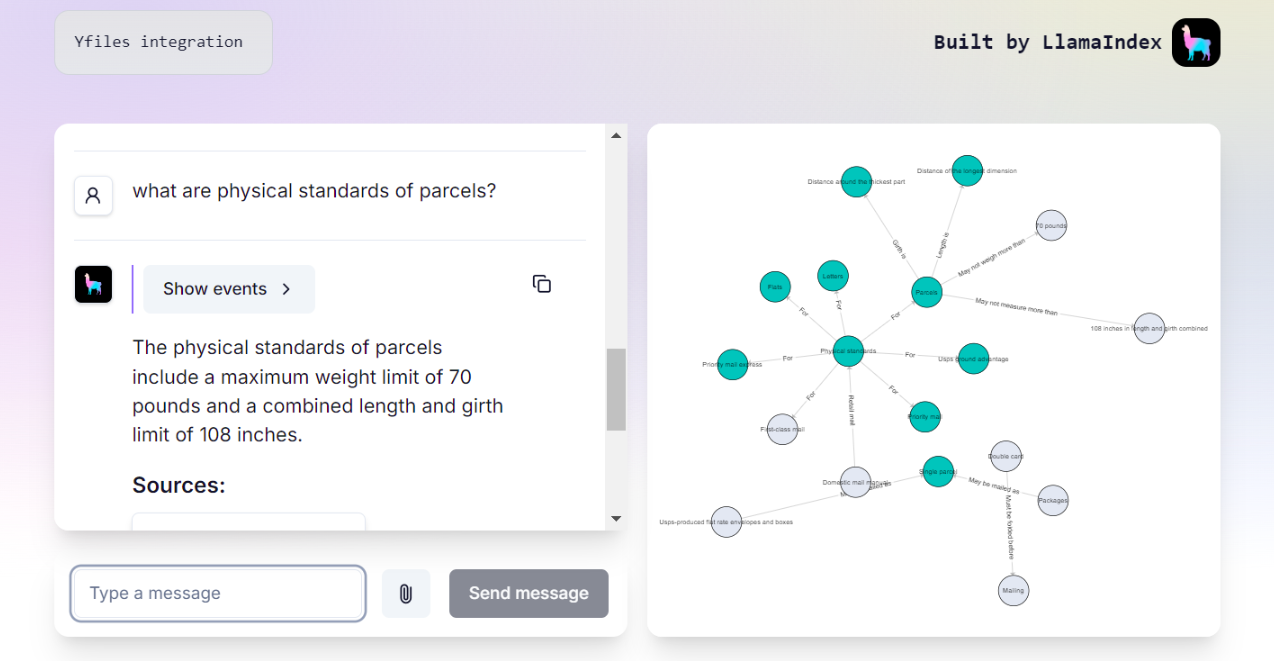
The implemented solution integrates a document-based querying system with yFiles for visualizing relationships in a graph structure. Users can upload a Document via the frontend interface. Upon submitting a query, the system computes a knowledge graph in real time, where relevant nodes, edges, and their respective relationships are dynamically generated.
The right panel displays this visual representation, providing an intuitive overview of the extracted insights. Additionally, the interface highlights key citations from the document (Image 4), presenting the corresponding answer chunks to enhance traceability and contextual understanding. This approach ensures both comprehensive visualization and robust citation tracking for improved information retrieval.
Creating knowledge graphs is time-consuming, computationally intensive, and financially expensive. The process involves extracting entities, identifying relationships, and rendering the graph, which can introduce delays, especially for large documents. Managing complex node-link structures requires significant computational resources, and scaling the solution may incur substantial costs, particularly for cloud deployments.
From the above Screenshot we can see that the application is an intelligent response system, where it understands what the proper query should be with the given prompt and generates top k sub-questions after the user sends the query. The Knowledge graph on the right is an interactive graph dashboard, which works flawlessly, one can double tap/click on a node to expand and navigate using the mouse scroll.
Conclusion
yFiles proves to be a powerful tool for enhancing LLM-based projects that rely on graph data structures. Its flexible and intuitive visualization capabilities simplify the interpretation of complex relationships, making it easier to analyze large datasets.
By integrating yFiles into your chatbot and LLM workflows, you can improve data exploration, enhance result clarity, and deliver insightful visualizations that empower users to make informed decisions. Whether you’re visualizing intricate data paths, managing interconnected datasets, or debugging AI-driven models, yFiles provides a comprehensive solution for turning complex information into actionable insights.
For frameworks like LlamaIndex, yFiles ensures efficient graph visualization, enabling developers to fully leverage the potential of knowledge graphs and build smarter, more reliable AI applications.
Key Takeaways
- Seamless Knowledge Graph Integration – yFiles enables intuitive visualization of complex relationships, making LlamaIndex-powered knowledge graphs interactive and insightful.
- Real-Time Graph Updates – The integration dynamically expands and highlights nodes in response to queries, providing instant, visual feedback on knowledge structures.
- Customizable and Interactive UI – Developers can modify layouts, styles, and colors programmatically, ensuring clear, user-friendly graph exploration.
- Optimized for AI Applications – yFiles enhances LLM-powered systems by simplifying debugging, data tracing, and contextual information retrieval.
- Effortless Deployment – With a structured setup process, integrating yFiles into AI workflows is straightforward, supporting various front-end frameworks like React and Angular.
The media shown in this article is not owned by Analytics Vidhya and is used at the Author’s discretion.
Frequently Asked Questions
Q1. What is yFiles and how does it help in visualizing knowledge graphs?
Ans. yFiles is a powerful SDK that simplifies visualizing complex networks. It enables interactive diagrams with dynamic graph layouts, node expansion, and real-time updates, making it ideal for visualizing data from frameworks like LlamaIndex.
Q2. How can I obtain the yFiles evaluation license?
Ans. Visit the yWorks Evaluation Portal to create an account, download the evaluation version, and obtain the required license key.
Q3. Why is my front end failing with a Failed to fetch knowledge graph info error?
Ans. This typically indicates that the backend isn’t running or there’s a misconfigured BACKEND_URL in your .env file. Ensure the backend is correctly started and the URL is set to http://localhost:8000.
Q4. How can I expand nodes dynamically in the visualization?
Ans. By default, yFiles’ GraphComponent supports expanding nodes by double-clicking. This reveals neighbouring nodes for improved exploration.
Q5. How can I customize node colours and styles?
Ans. yFiles allows developers to assign node colours dynamically based on data categories. You can modify node appearance through CSS or programmatically via the yFiles API.
Q6. Where can I find additional resources to enhance my yFiles integration?
Ans. Refer to the yFiles Documentation and the CreateLlama Repository for comprehensive examples and advanced features.
Hi! I'm Adarsh, a Business Analytics graduate from ISB, currently deep into research and exploring new frontiers. I'm super passionate about data science, AI, and all the innovative ways they can transform industries. Whether it's building models, working on data pipelines, or diving into machine learning, I love experimenting with the latest tech. AI isn't just my interest, it's where I see the future heading, and I'm always excited to be a part of that journey!


