-
How to Use Python to Automate Google Sheets? (2025 Edition)
Learn how to use Python to automate Google Sheets with our updated blog. Save time and effort by automating your Google Sheets with Python.
Lakshay arora 01 May, 2025
-
12 Univariate Data Visualizations With Illustrations in Python
Learn univariate data visualization using Python. Explore scatter plots, histograms, box plots, to uncover patterns in single-variable data.
Guest Blog 02 May, 2025
-
How Part-of-Speech Tag, Dependency and Constituency Parsing Aid In Understanding Text Data?
Delve into the depths of POS tagging and its applications in language processing. Strengthen your grasp on NLP fundamentals. Read Now!
Abhishek Sharma 12 Nov, 2024
-
Feature Transformation and Scaling Techniques to Boost Your Model Performance
Feature Scaling and transformation help in bringing the features to the same scale and change into normal distribution. Thus,
Purva Huilgol 20 Jun, 2024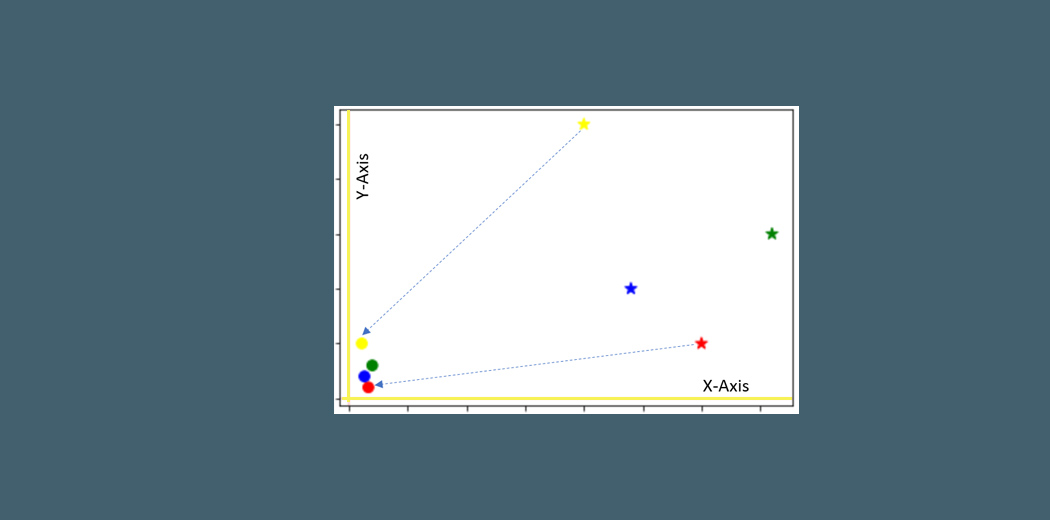
-
Everything you need to know before setting up Business Analytics!
Understand the challenges and impact measurements to be looked into while setting up Business Analytics for your organization.
amit_kumar 14 Oct, 2020
-
8 Data Visualization Tips to Improve Data Stories
Data visualization is not easy to master. Therefore, this article covers some esentials data visualization tips to create better visuals for your data.
Aniruddha Bhandari 28 Jul, 2020
-
5 Exciting Computer Vision Applications With Relevant Datasets!
Computer vision applications & projects from pose detection to image transformation. List of applications of computer vision. Read Now!
Shipra Saxena 02 May, 2025
-
Top 20 Visualization Dashboards for Mapping COVID-19
Data Visualization has played a key role in understanding the spread of Covid-19. Have a look at the 20 most compelling COVID-19 Dashboard across the globe.
Guest Blog 20 Jul, 2020
-
Different Keys in SQL (Primary Key, Candidate Key, Foreign Key)
Different types of keys in SQL, including candidate key and foreign key. Understand how they ensure data integrity and consistency.
Aniruddha Bhandari 02 May, 2025
-
9 Books to Start Your Business Analytics Journey
Business Analytics is one of the most booming job roles in the Data Science Industry. Top business analytics books which will help you learn and grow.
Abhiraj Suresh 04 Apr, 2025